
Bull Flag vs. Bear Flag: How Are They Different?

A flag pattern is a chart formation followed by technical traders to identify potential trend continuations. Traders often favor flag patterns due to the potential for significant trends that can emerge afterward. There are two main types of flag patterns: the bull flag and the bear flag. In this article, we’ll review bull and bear flags, and how to spot the differences between these patterns to make informed trading decisions.
Key Takeaways:
Distinguish between a bull flag and bear flag chart pattern by spotting the direction of the pole, and expect a breakout in the direction of the pole's trend.
Trade the pattern when the price breaks out of the consolidation phase on increasing volume.
Though flags include defined entry and exit points, the patterns may not always work out as expected, so always include a stop loss in your trades.
What Is a Flag Pattern?
A flag pattern is a technical analysis price pattern that indicates a continuation of the prevailing trend is about to begin. It’s a favorite of technical traders due to the powerful trends that can develop after it forms.

The flag pattern is characterized by two main components, a flagpole and a flag. The flagpole is the initial price move, which can be either bullish or bearish, and represents a strong and rapid price movement. Following the flagpole, the flag is formed. It appears as a rectangular or parallelogram-shaped consolidation period, often with parallel trend lines sloping in the opposite direction of the flagpole. The flag formation typically lasts for a relatively short period, ranging from a few days to a few weeks.
Bull Flag Pattern
A bull flag pattern is a specific type of flag formation that signals the continuation of an upward trend. It typically occurs after a sharp upward price rally, known as the flagpole, followed by a consolidation period. The flag in a bull flag pattern is characterized by consolidation in the opposite direction of the preceding uptrend.

During the formation of a bull flag, volume tends to decrease, indicating a lower selling pressure. This consolidation phase represents a temporary pause or a period of profit-taking by traders before the price resumes its upward trend. Once the consolidation is complete, the price breaks out above the upper trend line of the flag on increased volume, signaling a resumption of the bullish trend.
Bear Flag Pattern
A bear flag pattern is an upside-down version of the bull flag. The bear flag pattern signifies a continuation of a downward trend, and appears in the opposite direction of the bull flag pattern. It forms after a significant downward price decline, followed by a period of consolidation. In a bear flag pattern, the flag is characterized by upward-sloping parallel trend lines.
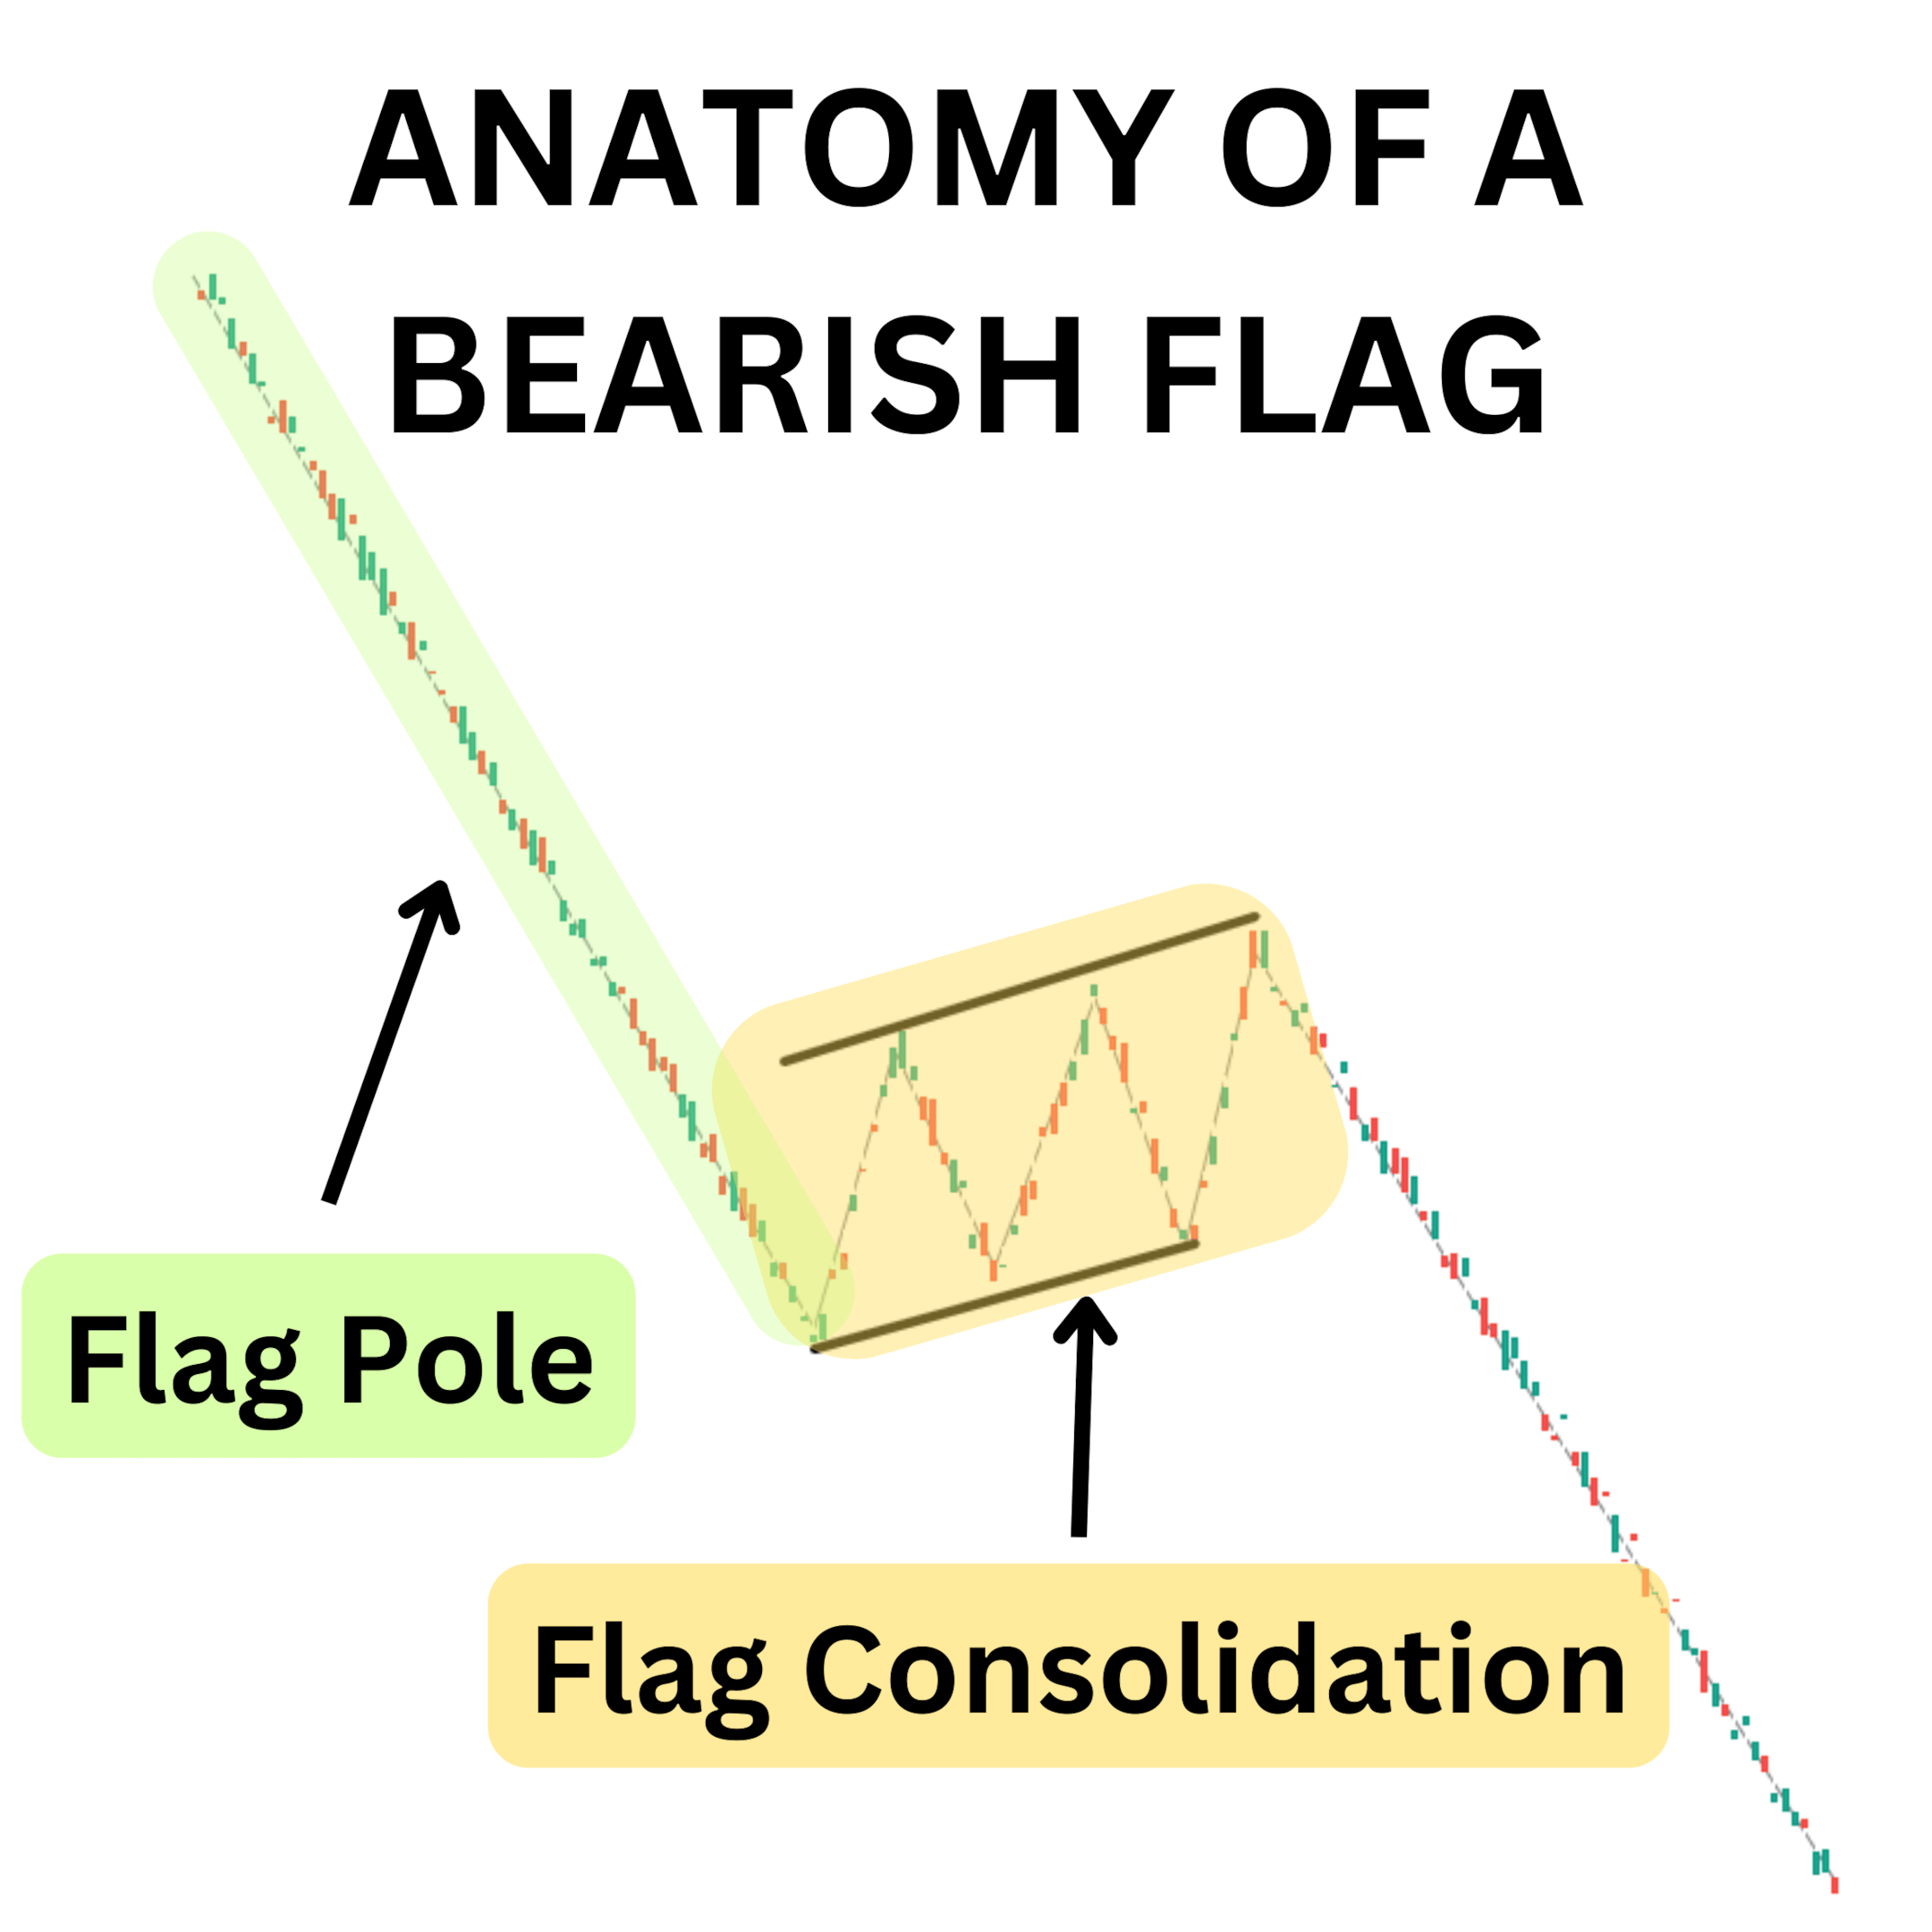
During the formation of a bear flag, volume tends to diminish, indicating a decrease in buying interest. Any rallies tend to be false signals of a bullish trend. This consolidation phase represents a temporary pause or a period of short-covering by traders before the price resumes its decline. Once the consolidation is complete, the price often breaks out below the lower trend line of the flag on high volume, signaling a continuation of the bearish trend.
What’s the Difference Between a Bull Flag and Bear Flag?
The bull flag and bear flag patterns are two distinct continuation patterns that traders encounter in the cryptocurrency market. While they share similarities in their structure and formation, there are critical differences between the two patterns.
The primary difference lies in their directional implications. A bull flag signals the resumption of an upward trend after a period of consolidation, indicating that buyers are regrouping and preparing for another push higher. Conversely, the bear flag, also a continuation pattern, signals a continuation of a downward trend, suggesting that sellers are regaining control and that the price is likely to decline further.
Another notable difference is in the slope of the flag formation. The flag tilts sideways or downward in a bull flag pattern, while the parallel lines incline upward in a bear flag pattern. These contrasting slopes reflect the temporary balance or pause in the market before the price continues in the prevailing direction.
Bull Flag | Bear Flag |
Flagpole is an uptrend | Flagpole is a downtrend |
Flag formation portion drifts lower | Flag formation portion drifts higher |
Price breaks higher | Price breaks lower |
Understanding the differences between bull and bear flags can help traders spot potential trading opportunities. Consider combining these patterns with other analyses to confirm their validity and increase the likelihood of successful trades.
How to Trade Flag Patterns
Bull and bear flags are valuable trading patterns, providing insights into potential trend trading opportunities. Once armed with the knowledge of how to trade flag patterns, traders can effectively capitalize on these formations. Below, we’ll explore strategies for trading both bull and bear flag patterns.
How to Trade a Bull Flag
The bullish flag pattern involves identifying the consolidation phase within an upward trend and preparing for a potential continuation of the bullish movement. Below are four key steps to consider when trading a bullish flag pattern.
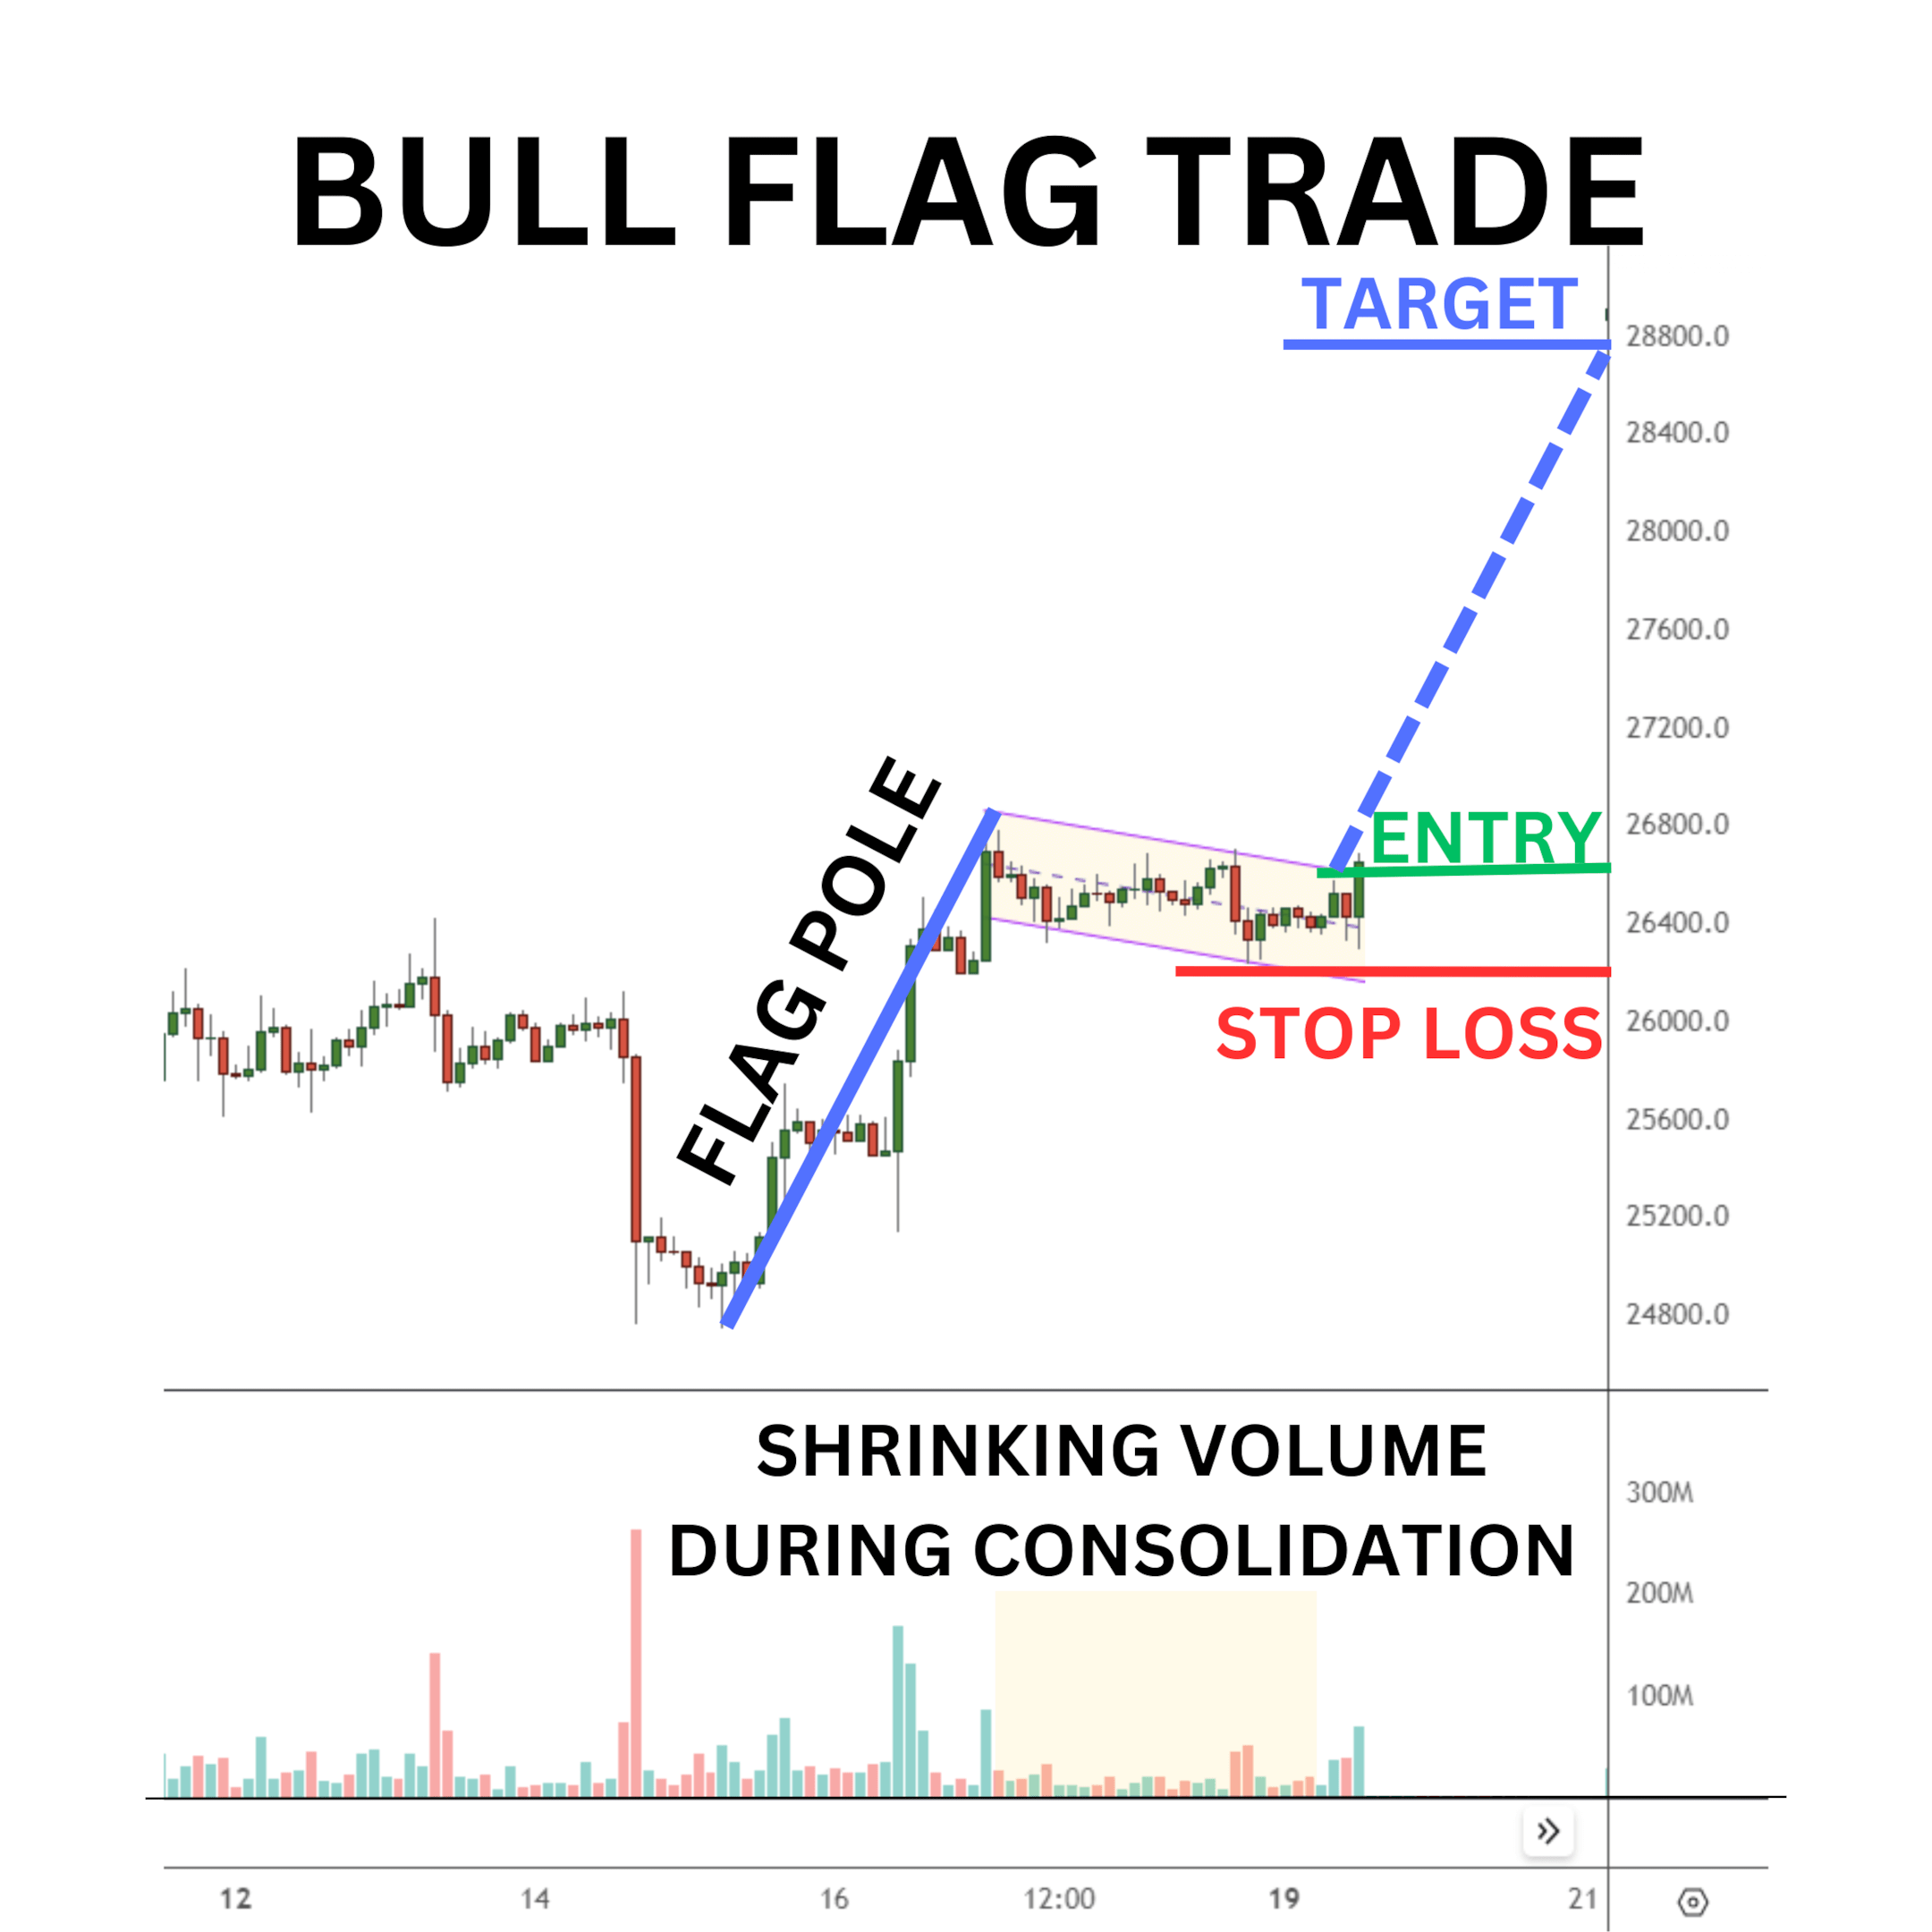
Identify the Bull Flag: Look for a sharp upward price movement (bullish pole) followed by a period of consolidation (flag). The flag should have downward-sloping parallel trend lines.
Entry Point: The entry price trends above the upper resistance line of the flag. If the flag is sideways and not downward-sloping, then trade a long position on the flat top breakout.
Target Price: A bull flag could see prices rally a similar distance as the pole. Measure the length of the pole and project it upward from the breakout point. This can serve as your profit target for the price trend.
Stop Loss: The stop loss for the bullish flag will be the lowest point of the flag structure. When the price breaks higher, a retest of the low point suggests another pattern is at play.
How to Trade a Bear Flag
Trading bear flags is similar to trading bull flag patterns, but in a downward direction.
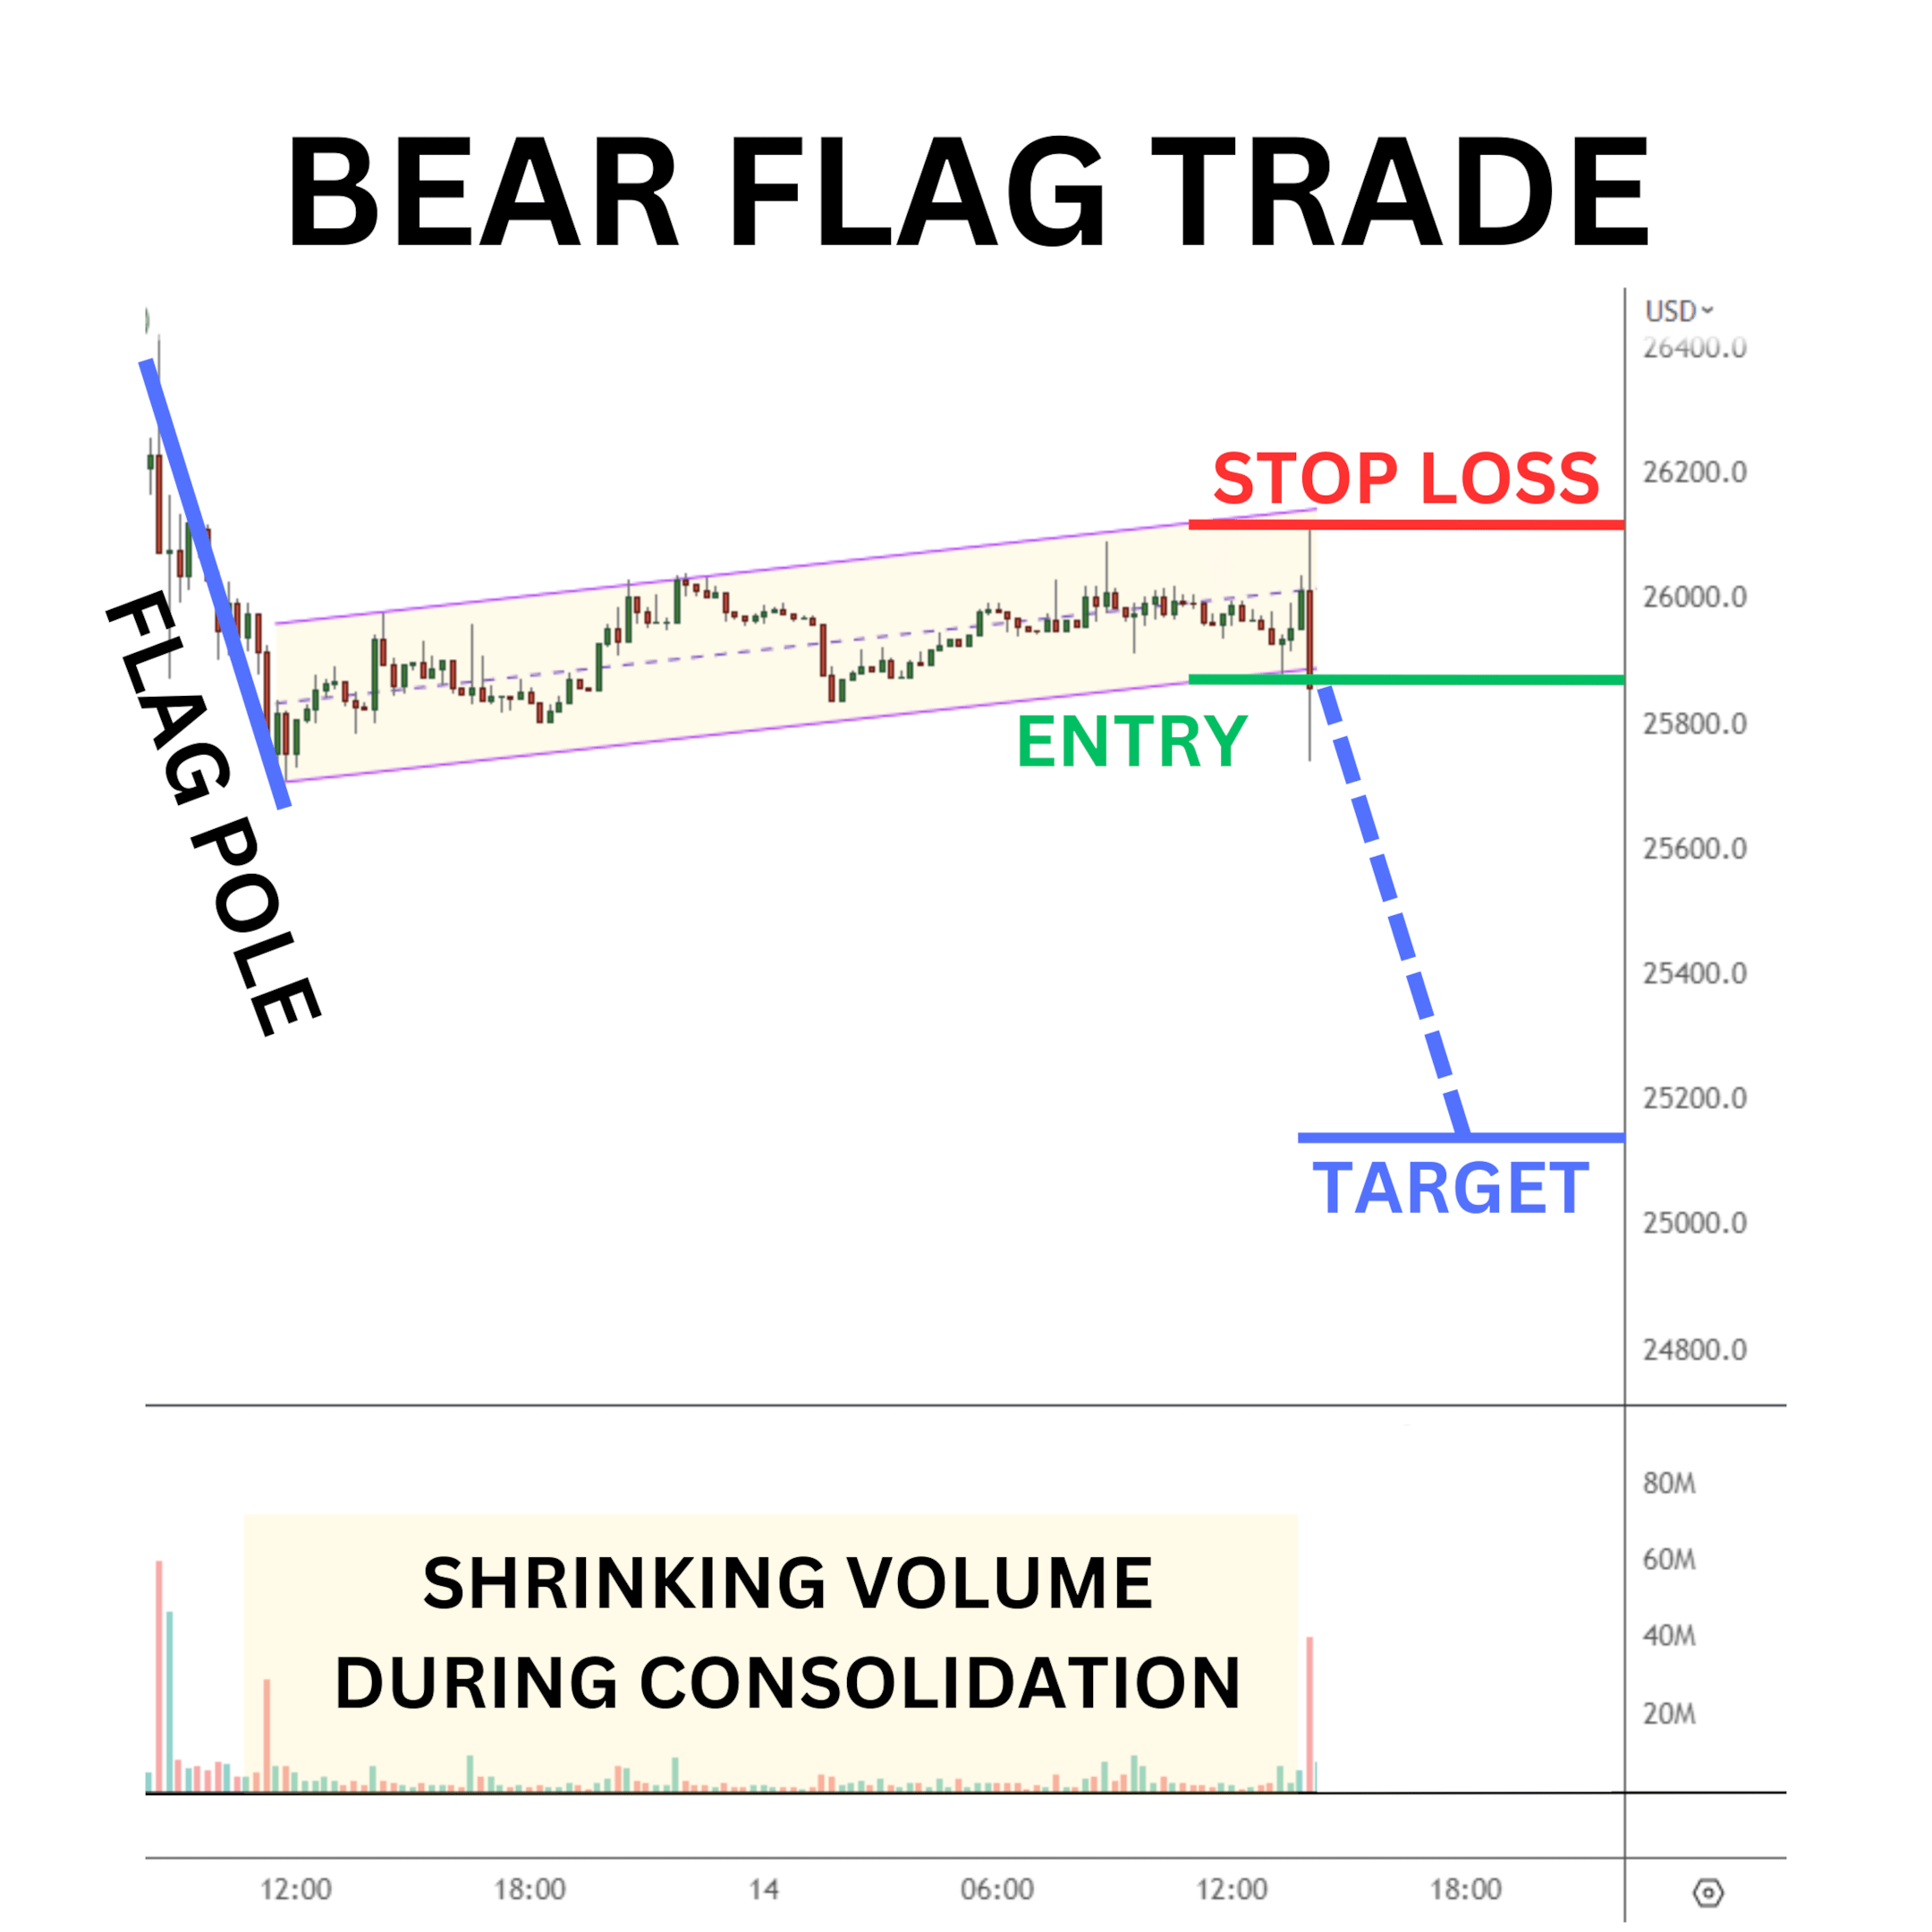
Identify the Bear Flag: Locate a significant downward price trend (bearish pole) followed by a sideways range (flag). The bearish flag consolidation should be upward-sloping.
Entry Point: Enter a short position when the price breaks down below the support level on strong volume. This breakdown suggests a continuation of the preceding downtrend.
Target Price: Measure the length of the pole and project it downward from the breakout entry point. This can serve as a potential target for further price depreciation.
Stop Loss: The stop loss will be placed above the highest point of the consolidation.
Benefits and Risks of Bull and Bear Flag Patterns
Trading the flag chart pattern can offer several benefits for traders. Here are some advantages:
Trend Continuation Signals: Bull and bear flag patterns provide valuable indications of a trend’s direction, allowing traders to align their positions with the prevailing market trend.
Defined Entry and Exit Points: These patterns offer clear entry and exit points based on breakout levels, which can help traders set up precise entry orders and manage their positions effectively.
Risk-to-Reward Ratio: Flag patterns often have well-defined stop-loss levels based on the breakout points, allowing traders to calculate and maintain favorable risk-to-reward ratios for their trades.
Though the bull and bear flags have their advantages, there are some risks associated with trading flag patterns as well, as follows:
False Breakouts: Occasionally, flag patterns may exhibit false breakouts in which the price briefly breaks out of the pattern and then quickly reverses, resulting in potential losses for traders.
Market Volatility: Flag patterns can form during periods of high market volatility, which may lead to increased price fluctuations and a higher level of risk, especially when leverage is used.
Failed Patterns: Not all flag patterns result in successful trades. Sometimes, the price may break out without traveling the expected distance.
By understanding the benefits and risks of trading bull and bear flag patterns, traders are better prepared to make better decisions, manage their risks effectively and enhance their overall trading performance.
Flags vs. Pennants
Since bull and bear flag patterns are commonly used in technical analysis, it's crucial to differentiate them from a similar pattern, known as a pennant. Below are the key distinctions between flags and pennants.
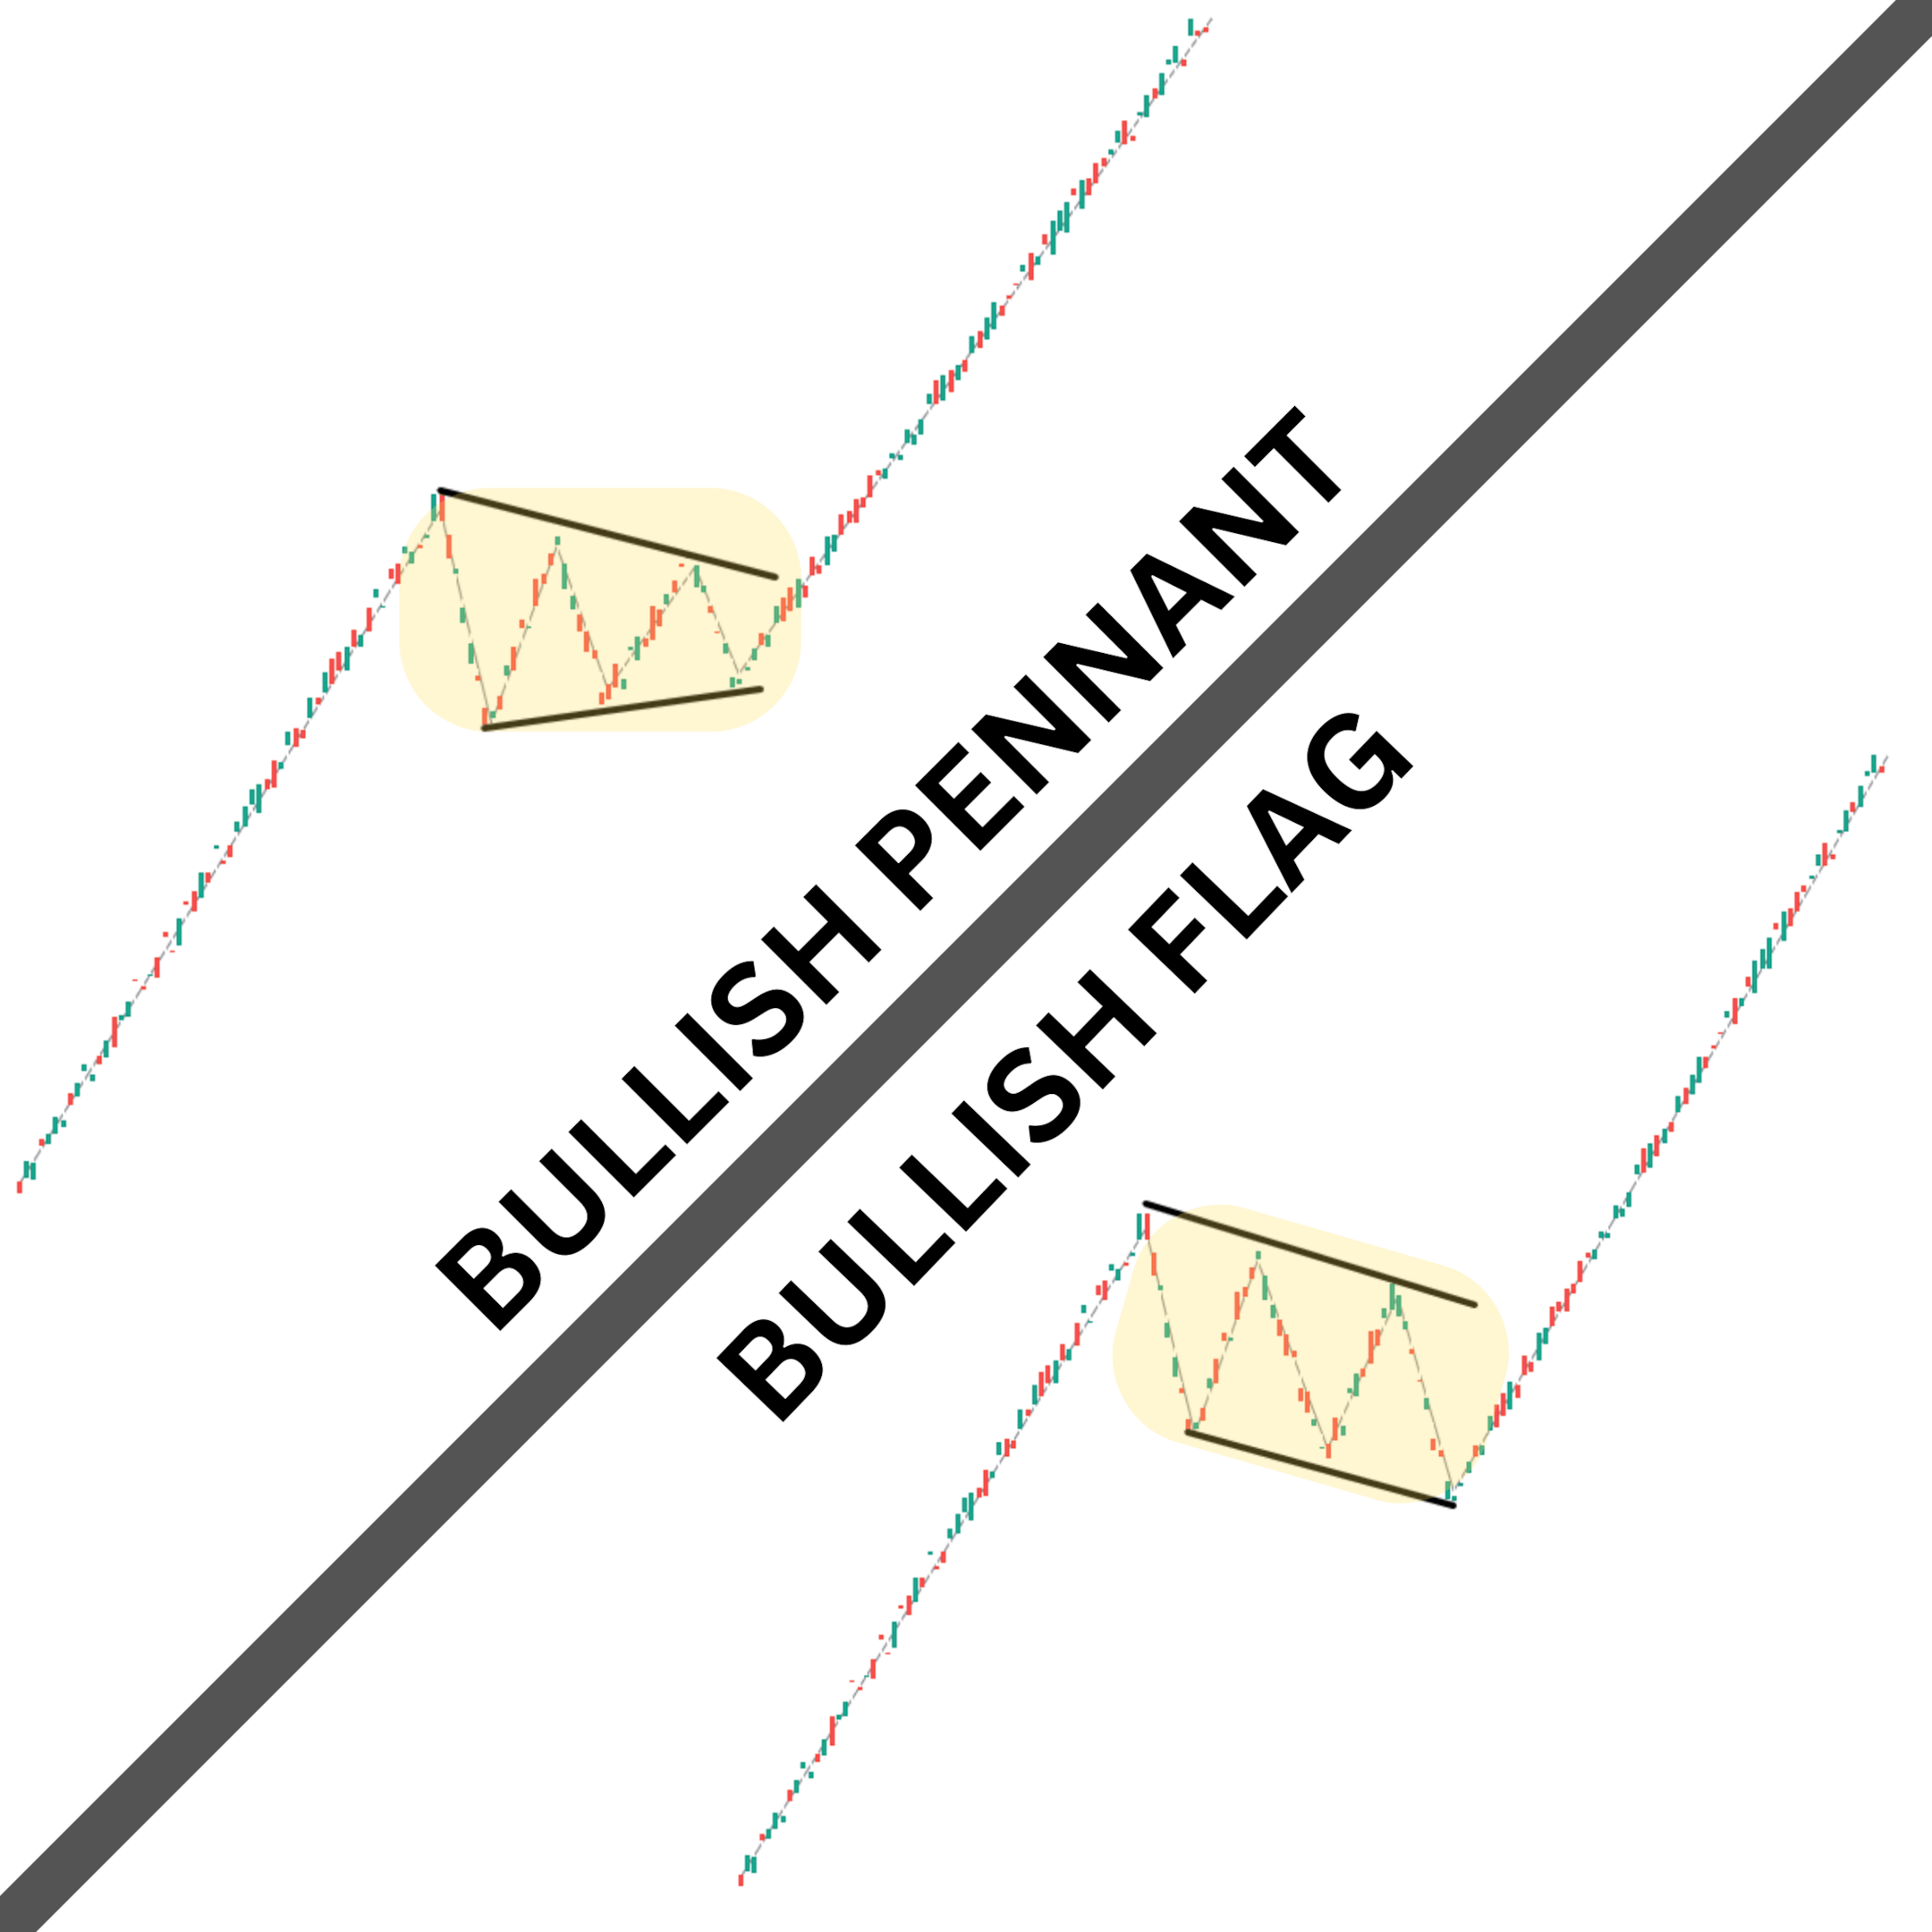
Shape: Both flags and pennants are consolidation patterns, but their shapes differ. Flags have a rectangular or parallelogram shape, while pennants more closely resemble a small symmetrical triangle.
Slope of the Trend Lines: In bull and bear flag patterns, the trend lines within the formation slope in the opposite direction of the preceding price move. In contrast, pennants have trend lines that converge toward each other, forming a symmetrical triangle.
Duration: Flags typically have a longer consolidation period than pennants, which often form over a shorter duration.
Understanding the differences between flags and pennants will help traders accurately identify and interpret these distinct chart patterns. By incorporating both chart patterns into their technical analysis, traders can broaden their trading opportunities.
The Bottom Line
In conclusion, bull and bear flags are valuable patterns for traders, providing insights into potential trends and allowing traders to align their positions with the prevailing market direction. Traders can enhance their trading strategies and navigate the dynamic market more effectively by incorporating flag patterns into their analysis.
Candlestick Patterns Professional Traders Use
Best candlestick patterns — A curated list of candlestick patterns frequently used by traders
How to Read Candlestick Charts in Crypto — Learn the basics of candlestick patterns
Crypto Chart Patterns — (Chart basics: Trend, neckline, wedges)
Doji Candlestick — Basic candlestick unit
Bullish candlestick patterns
- Inverted Hammer
- Bullish Engulfing
- Cup and Handle
- Morning Star
- Three White Soldiers
- Triple Top and Bottom
- Falling Wedge
- Dragonfly Doji
Bearish candlestick patterns
- Bear Flag
- Gravestone Doji
- Head and Shoulders
- Dark Cloud Cover
- Shooting Star
- Rising Wedge
- Hanging Man
- Bear Pennant
- Triple Top and Bottom
- Descending Triangle
Other candlestick patterns
- Harami
- Hammer
- Double Top and Bottom
- Spinning Top
- Marubozu Candlestick
- Tweezer Top and Bottom
- Continuation Patterns
- Symmetrical Triangle
- Inside Bar
#Bybit #TheCryptoArk
