
The Ultimate Guide to the Best Swing Trading Indicators

Imagine unlocking the secrets to successful swing trading, capturing price swings, and maximizing profits with the help of the best swing trading indicators. In this journey through the world of swing trading, we will master the use of various technical indicators, from momentum to trend and volume, to make informed decisions and outperform the market using the best swing trading indicators.
Key Takeaways
Swing trading is a strategy used to capture price swings and maximize profits.
Momentum, trend, and volume indicators are essential tools for swing traders.
Risk management strategies like stop losses should be employed to protect capital.
Understanding Swing Trading
Swing trading is a popular trading strategy that involves holding positions for short to medium periods, aiming to capture price swings and maximize profits using technical and fundamental analysis. Grasping swing trading indicators, including the use of a reliable swing trading indicator, is key to identifying suitable stocks for your unique risk level and trading approach, and also to determine the right times for entry and exit. As a swing trader, while day trading focuses on short-term trades within a single day, swing trading allows for a more extended timeframe, different from position trading, which involves holding positions for longer periods. Incorporating various trading strategies, such as swing trading, can help traders diversify their portfolio and adapt to market conditions.
Momentum Indicators for Swing Trading
Momentum indicators hold a significant role in swing trading, aiding traders in pinpointing the force of a trend and possible reversals. Utilizing indicators such as the Relative Strength Index (RSI) and the Stochastic Oscillator enables swing traders to gain a clearer understanding of market conditions and make smart decisions to optimize their profits.
Relative Strength Index (RSI)
The Relative Strength Index (RSI) is a widely-used momentum indicator that measures the speed and magnitude of price movements, helping traders identify overbought and oversold conditions and potential trend reversals. Swing traders often use the RSI indicator to pinpoint when a cryptocurrency is overbought or oversold. This helps them make profitable trading decisions. When a security is overbought or oversold, the RSI can indicate a heightened likelihood of a pullback or correction. Identifying these corrections in advance can help traders capitalize on potential profits.
RSI serves as a beneficial instrument for making trading decisions. It can also be used to observe center line crossovers. The RSI indicator is a useful tool when trying to gauge the strength of a trend. When it passes its center line, it indicates that the trend is rising. Divergence between the RSI and the actual price action of a security can also be a valuable tool for anticipating trend reversals, especially when the market is in a trend.
Stochastic Oscillator
The Stochastic Oscillator is another well-regarded momentum indicator that juxtaposes an asset’s closing price with its price range over a designated period, assisting traders in determining overbought and oversold levels and predicting trend reversals. The Stochastic Oscillator is depicted on a chart between zero and 100, with overbought and oversold zones above 80 and below 20, respectively.
Traders utilize the Stochastic Oscillator for the following purposes:
Detect overbought and oversold levels
Observe for the two lines to intersect, which typically indicates a trend reversal
Monitor values above 80 and below 20
Benefit from employing the Stochastic Oscillator for crossovers and divergences
However, it is prudent to combine this indicator with other forms of technical analysis to account for volatility.
Trend Indicators for Swing Trading
Trend indicators like Moving Averages and Moving Average Convergence Divergence (MACD) are examples of technical indicators that offer useful perspectives on the course and intensity of a market trend. Recognizing trends and their intensity allows swing traders to make smarter decisions and potentially seize larger profits.
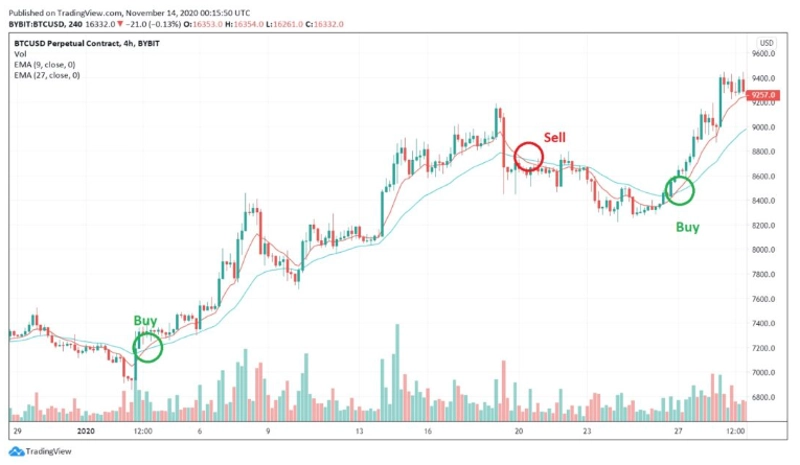
Moving Averages
Moving averages are simple yet effective trend indicators that smooth out price data, helping traders identify trends and potential entry and exit points. They can be calculated using Simple Moving Averages (SMA) or Exponential Moving Averages (EMA), with the latter placing greater emphasis on recent price action by assigning it a higher weightage.
When a short-term moving average crosses a long-term moving average, it may indicate a good opportunity to buy, which is a bullish signal. This method, referred to as crossovers, can serve as a significant tool for swing traders aiming to optimize their profits.
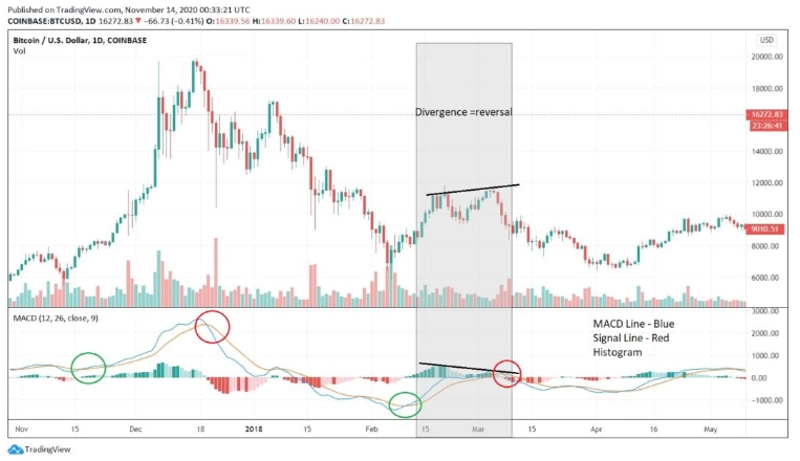
Moving Average Convergence Divergence (MACD)
The Moving Average Convergence Divergence (MACD) is a versatile trend-following indicator that uses moving averages to determine an asset’s momentum, providing valuable insights for swing traders. It is calculated by subtracting the 26-period Exponential Moving Average (EMA) from the 12-period EMA, although these parameters can be adjusted as per the user’s requirements.
For optimal results in swing trading with Moving Averages and MACD, the latter should be utilized to confirm the signals generated by the Moving Averages. When the Moving Averages cross over or diverge, confirmation from the MACD should be sought to validate the signal.
Volume Indicators for Swing Trading
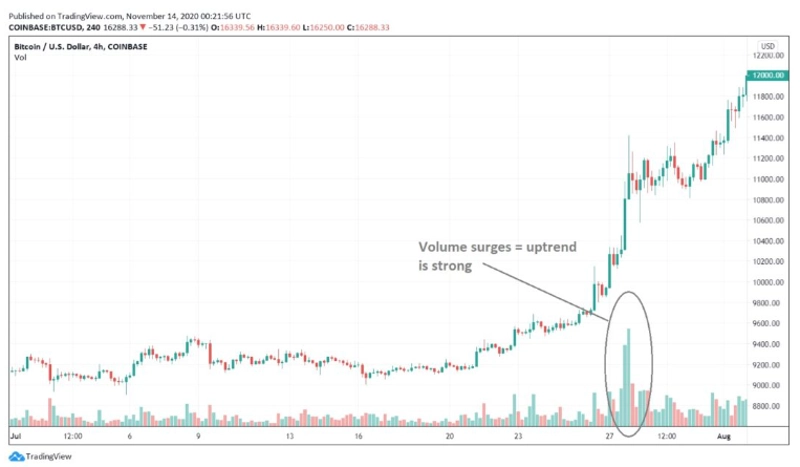
Volume indicators like On-Balance Volume (OBV) and Volume-Weighted Average Price (VWAP) gauge trading activity and liquidity, offering swing traders useful data to verify trends and spot potential trend reversals.
On-Balance Volume (OBV)
The On-Balance Volume (OBV) is a momentum-based volume indicator that adds and subtracts volume to confirm trends and detect bullish or bearish divergences. OBV accumulates the trading volume on days when the price rises and subtracts the volume on days when the price falls, making it easier to identify volume trends and divergences.
Noteworthy surges in volume may distort the indicator, so it is important to monitor an economic calendar. Additionally, the shorter the time frame, the less dependable this indicator is.
Volume-Weighted Average Price (VWAP)
The Volume-Weighted Average Price (VWAP) is a volume indicator that calculates the average price of an asset, weighted by volume, providing insights into liquidity and potential support and resistance levels. The VWAP can provide insight into the liquidity of an asset by helping traders identify points of liquidity at certain price levels throughout the trading day.
When the VWAP is close to the current price, it suggests high liquidity or a significant amount of trading activity. Conversely, when the VWAP is distant from the current price, it suggests lower liquidity. Traders can utilize VWAP to identify potential support and resistance levels as well.
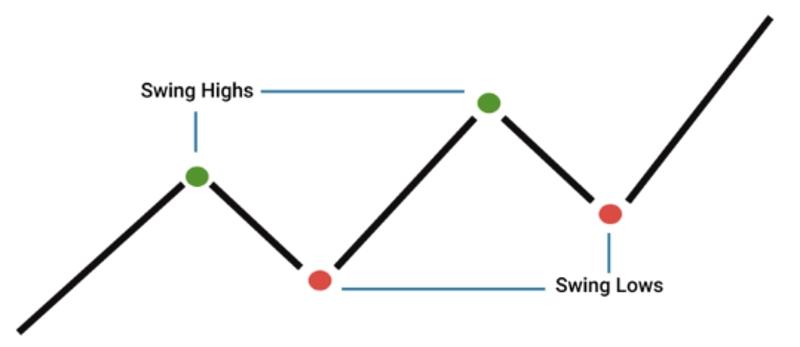
Support and Resistance Levels in Swing Trading
Determining support and resistance levels is vital for swing traders, as these levels can signal potential trend reversals and suggest entry and exit points. Techniques for determining support and resistance levels in swing trading include:
Flipping support and resistance dynamics
Pinpointing swing points
Constructing horizontal lines
Utilizing pivot points
Recognizing areas of supply and demand
These techniques can be beneficial for identifying support and resistance levels in swing trading.
Combining Indicators for Optimal Results
Employing a combination of indicators can yield more precise and trustworthy trading signals, aiding swing traders in making smarter decisions. For instance, combining RSI and Stochastic Oscillator for swing trading can provide stronger signals for entry or exit points, while using Moving Averages and MACD together can help increase the accuracy of swing trading signals.
Risk Management Strategies for Swing Trading
Adopting risk management strategies like stop-loss orders and position sizing is imperative for swing traders to safeguard their capital and boost profits. Stop-loss orders help to limit potential losses on a trade by automatically selling a stock when it reaches a predetermined price, while position sizing involves calculating the number of shares or contracts to buy or sell based on factors such as risk tolerance, account size, and the specific trade setup.
Summary
In conclusion, mastering the use of various swing trading indicators, such as momentum, trend, and volume indicators, can help traders make more informed decisions, maximize profits, and minimize risks. By identifying trends and their strength, detecting potential reversals, and implementing risk management strategies, swing traders can outperform the market and achieve success in this exciting and potentially profitable trading style. #Bybit #CryptoArk
Frequently Asked Questions
Which indicator is best for swing trading?
The moving average indicator is the best for swing trading, allowing traders to chart days ranging from five to 200.
What is the most successful swing trading strategy?
The most successful swing trading strategy involves using simple moving averages (SMAs), looking for breakouts with trendlines, support and resistance levels, and chart patterns such as triangles and flags. It is also important to enter trades where there is a favorable risk/reward ratio and exit trades with a specific plan. Being disciplined about taking small losses is also key to successful swing trading.
What is the best chart setup for swing trading?
The ascending triangle pattern is one of the best swing trading chart patterns for predicting bullish reversals, signaling that the buyers are in control and the stock is likely to swing up.
What is the best RSI value for swing trading?
For swing trading, it is generally recommended to use a 14-period RSI with overbought and oversold levels set at 70 and 30, respectively.
What is the main difference between swing trading and day trading?
Swing trading involves holding positions for short to medium periods and focuses on capturing price swings, while day trading requires closing all positions before the end of the day and relies more on intraday price movements.