
Supply and Demand Zones: Tips For Successful Trading

Supply and demand zones are a popular concept in technical analysis and trading that can help traders identify potential areas of market reversals or trend continuations in cryptocurrency markets. Understanding how supply and demand levels work can be an invaluable tool for traders looking to make more informed decisions in the financial markets.
In this article, we’ll provide an overview of the successful use of supply and demand zones in cryptocurrency trading, including identifying these zones on price charts and implementing them in a trading strategy, and their pros and cons. Whether you’re a new or experienced trader, mastering the art of supply and demand zones can give you an edge in trading.
Key Takeaways:
Supply and demand zones are consolidation areas that occur before an explosive upward or downward price movement.
You can find supply and demand zones by identifying strong impulse waves, which are represented by large green or red candles that signal a sharp uptrend or downtrend.
There are three rules to ensuring the credibility of a supply and demand zone: strength, time and freshness of the zone.
What Are Supply and Demand Zones?
Supply and demand zones are price areas where larger market participants, such as whales or institutional asset managers, are presumed to be accumulating (buying) or distributing (selling) cryptocurrency. Relatively sideways consolidations characterize these zones before an explosive move. Supply and demand zones can indicate a possible reversal or continuation of an existing trend.
An impulse wave or move must be present to use supply and demand zones effectively. This move is a quick and pronounced shift in price direction populated by large red (downswing) or green (upswing) candles. A consolidation zone would be considered normal price consolidation without this impulse move.
In technical analysis, cryptocurrency prices are solely determined by the interaction between supply and demand. When demand exceeds supply, prices rise, and when supply surpasses demand, prices fall. This dynamic is roughly balanced at times, resulting in price consolidations within a range.
Therefore, supply and demand zones are a form of consolidation, or relatively sideways price action, that occurs before an explosive move. The impulse wave indicates that the market is leaving a supply or demand zone, and traders can use it to identify an imbalance between buy and sell orders. This imbalance marks the start of a trend. Traders use supply and demand zones to determine price ranges where demand decreases and supply increases during downtrends, and where demand increases and supply decreases during uptrends.
The following Bitcoin chart depicts some of the supply and demand zones over a 2-year period.
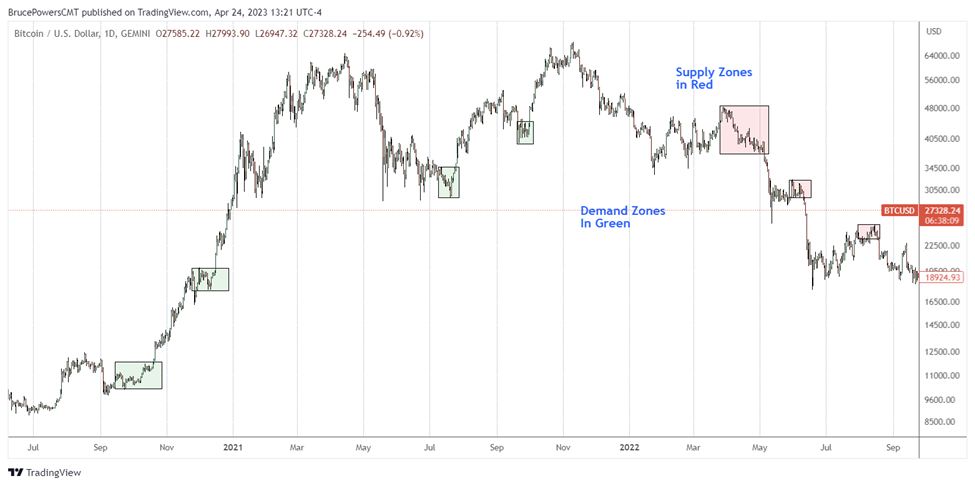
Supply Zone
A supply zone is a price area that marks the beginning of a sharp, fast downtrend move, either as a bearish reversal or downtrend continuation. Typically, selling or distribution takes place within the supply zone. Eventually, a significant imbalance will result in a rapid decline in prices. You’ll profit from shorting in a supply zone.
Demand Zone
A demand zone denotes a price range that signals the start of a sharp uptrend, either as a bullish reversal or uptrend continuation. Within the demand zone, accumulation or buying is occurring. At some point, an imbalance between supply and demand occurs, leading to a swift rise in price. You can take a long position to profit from a demand zone.
How to Find Supply and Demand Zones
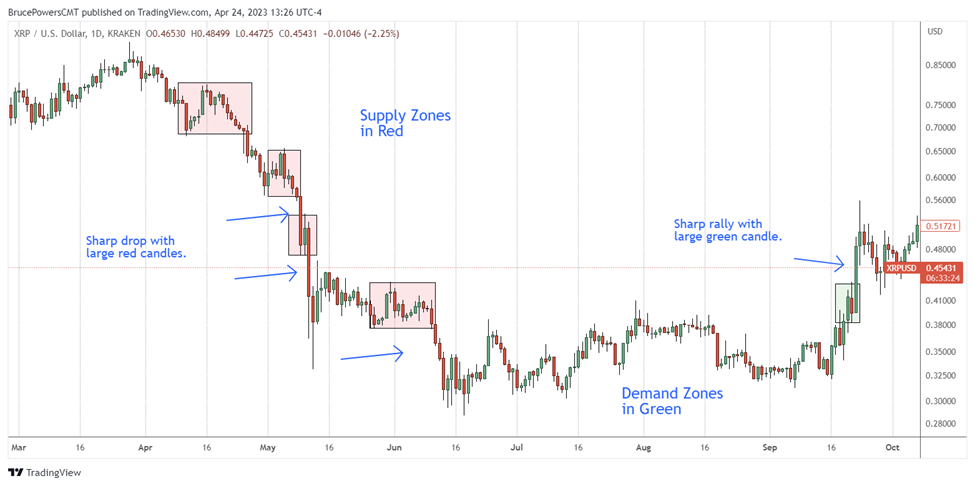
To identify supply and demand zones, we want to look for impulse moves. An impulse move shows a clear imbalance between the two forces of supply and demand, culminating in a sharp move either up or down. When scanning charts, look for large red or green candles within a sharp trend to quickly find supply and demand zones.
Furthermore, for trend continuation setups, look for short bases following an impulse wave in anticipation of a continuation. Sharp swings frequently consolidate for a short time before price continues to trend again. This is especially true with impulse waves.
This next daily chart of XRP/USD showcases some examples.
How to Draw Supply and Demand Zones
Supply and demand zones are found at the beginning of an impulse move. Therefore, first find the impulse moves to determine the supply and demand zones.
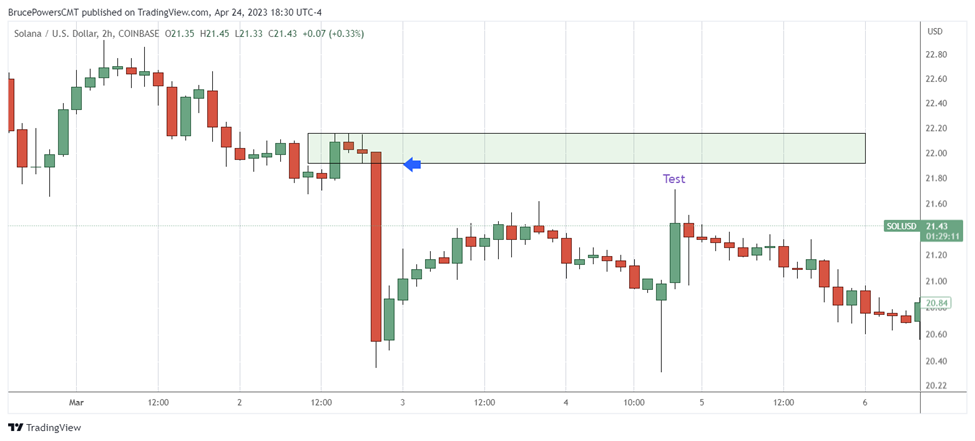
How to Draw a Supply Zone
First, find a declining impulse move and look at the beginning of the move. Start drawing the top horizontal line from the highest candle wicks of the zone, then extend the rectangular box to the lower line where downside momentum is triggered, that is, at the beginning of a long red candle, as shown below.
How to Draw a Demand Zone
When looking to draw a demand zone, you first want to find a sharp rally or an ascending impulse move. Then, find the consolidation zone near the beginning of the move. Start drawing the rectangle at the lower wicks of the demand zone, and end where the large green candle begins to show upward momentum improving. The beginning of the green candle’s breakout area is where momentum has taken off.
Rules of Supply and Demand Zones
Strength
The stronger the price move after the zone, the greater the credibility of the zone. What is the strength (up or down) of the movement following a supply or demand zone? This analysis is largely a judgment call, but there are a few things to look for to increase accuracy. First, are there relatively larger green (uptrend) or red (downtrend) candles? Is the move faster and more significant than has been seen recently? Did the breakout take off immediately — or hesitate?
Time
Time refers to the amount of time that a supply or demand zone takes to form — in other words, how long it takes for the consolidation period to develop. A zone that has been in place for an extended period is likely to be stronger and more reliable, because the longer the basing period, the greater the potential for a sharper and longer move once a breakout or breakdown occurs.
Freshness
One of the most important things to consider when identifying a supply and demand zone is how fresh it is. Freshness relates to whether the zone has been tested yet, or how many times it’s been tested. The fewer tests, the fresher it is. A fresh zone is more likely to function as a supply and demand zone once again during a pullback, presenting a second opportunity to enter. However, the more frequently a zone has been tested, the more likely it will be busted.
The notion of freshness in supply and demand zones is unlike that of support and resistance, where price levels gain strength from being retested multiple times by the market.
Best Supply and Demand Zone Strategies
Supply and demand zone trading strategies include setups for trend reversals and continuations. However, this is one tool for market analysis, and the quality of the analysis can be enhanced by using other market analysis or technical indicators along with supply and demand analysis.
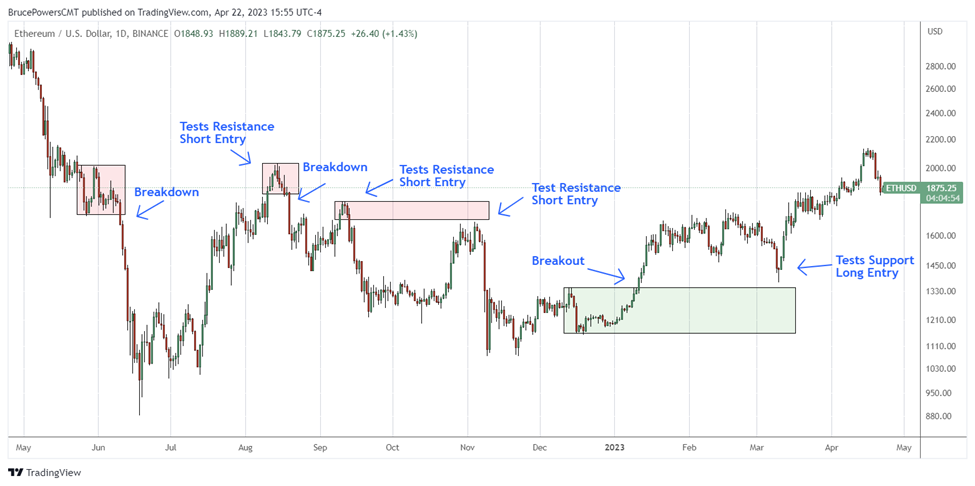
Pullback Strategy
In the pullback strategy, a trader is looking to enter the market following the first test to the zone. When a sudden move or impulse wave occurs, a certain degree of pullback typically follows. You can enter on that pullback if it returns to the zone, as it usually provides a safer entry with a tighter protective stop.
When an uptrend breaks out from a demand zone, the trader waits for the price to “pull back” to the zone's support level in anticipation of a continued upward movement. In the case of a breakdown from a supply zone, the trader is looking for a pullback into the resistance of the zone in anticipation of a bearish continuation.
When defining the entry, traders will look at other technical indicators for momentum and price patterns to confirm the setup. For example, see if you can spot the signs for confirmation in the chart below. A double top and a bullish hammer confirm the reversals in the chart below.
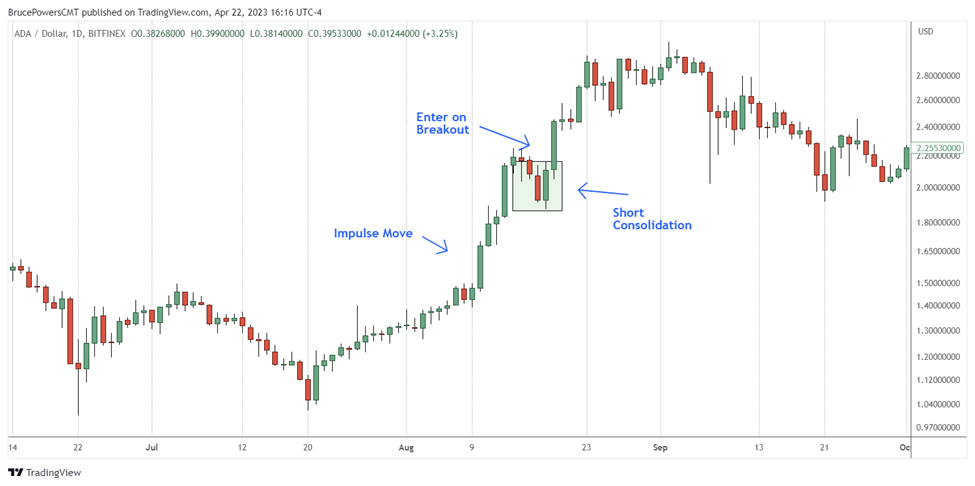
Breakout Strategy
In the case of the breakout strategy, traders are seeking a relatively short area of consolidation for a trend continuation following an initial impulse move. This first chart shows a bullish breakout strategy.
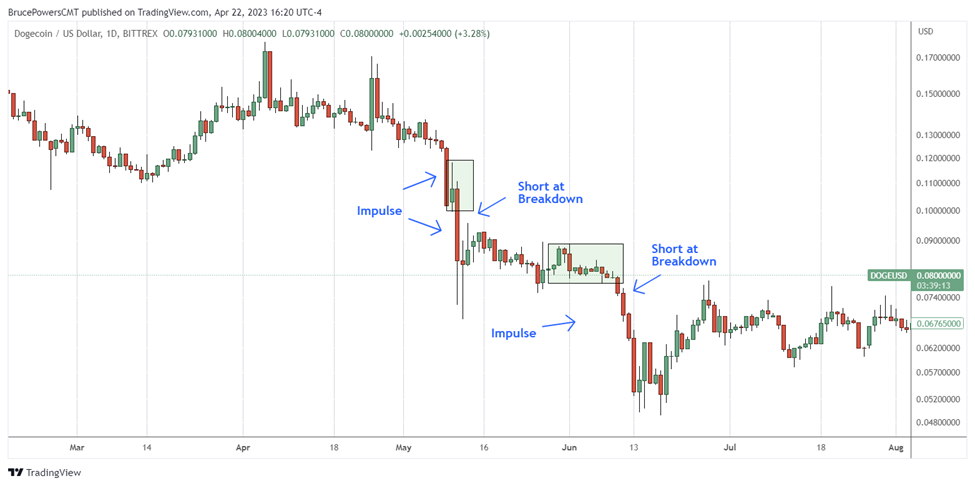
Below is an example of a bearish breakout trend continuation strategy.
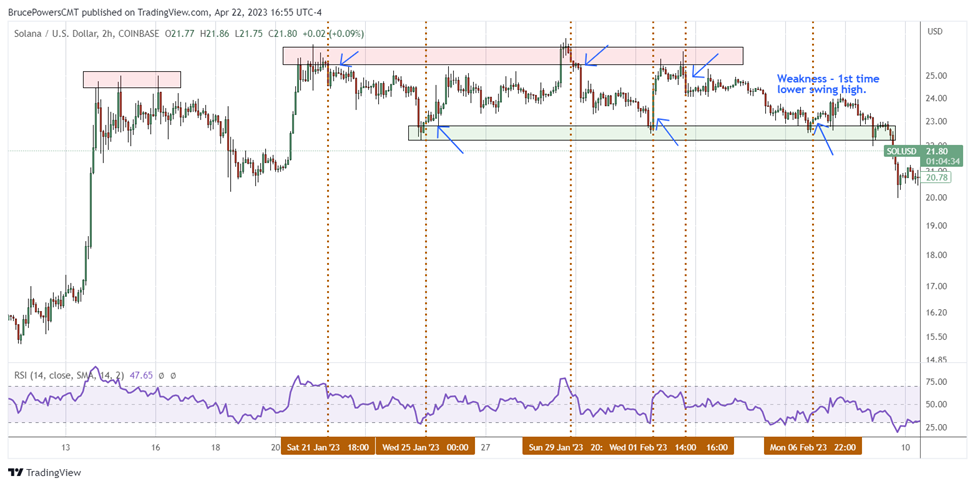
Range Trading Strategy
The range trading strategy involves trading within a specific price range that’s defined by a supply zone and a demand zone. Traders aim to buy near the lows of the range and sell near the highs, or vice versa. They then exit the trade when the price reaches the opposite side of the range.
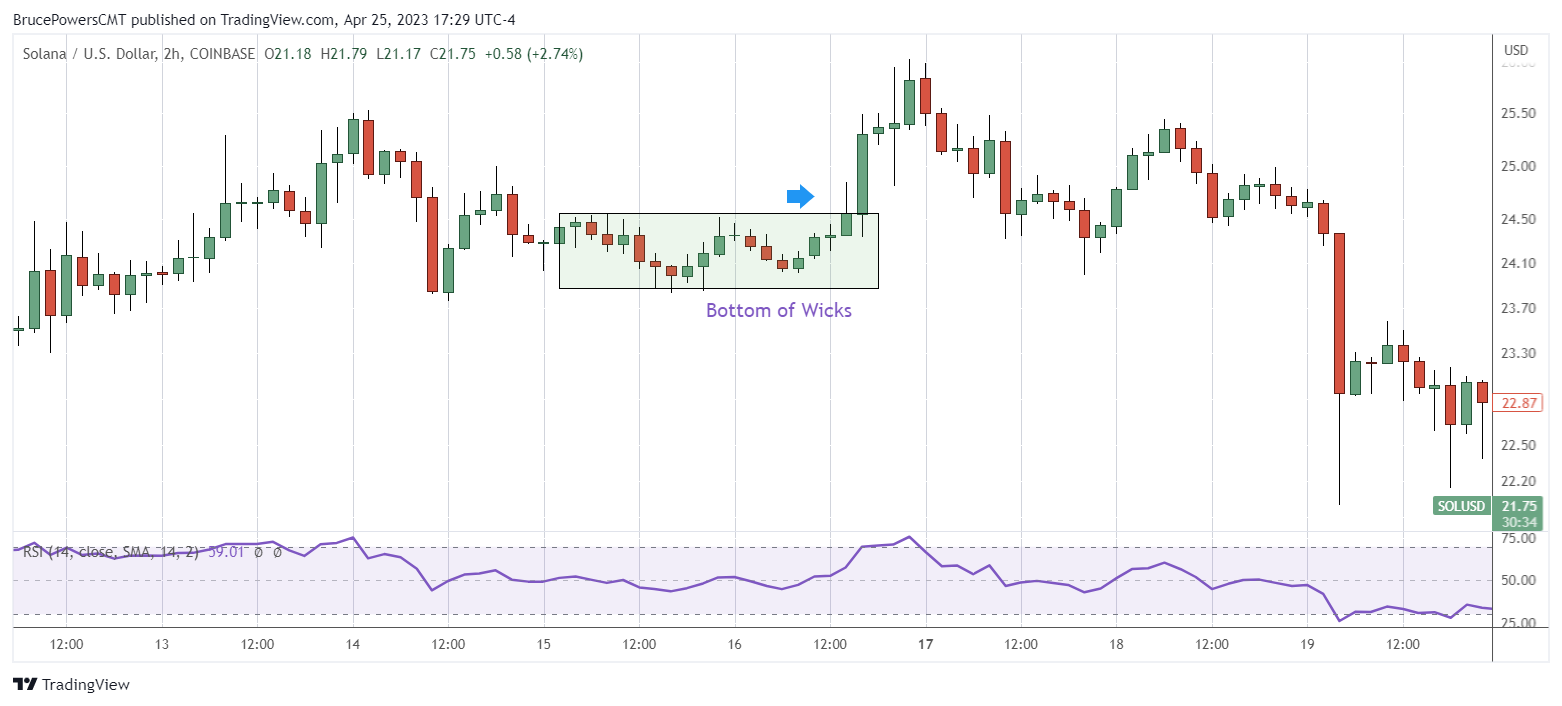
A momentum oscillator can be helpful in timing the trades for this strategy. The example below uses the 14-day relative strength index (RSI) indicator. Generally, an intraday time frame is going to be more useful in trading cryptocurrency with this strategy, though it also depends on the volatility of the cryptocurrency traded.
While analyzing candle setups alone may not always provide clear insights, the RSI indicator can confirm the observations in price behavior. The vertical lines illustrated below identify when the RSI turns up for buying opportunities, and down for selling opportunities.
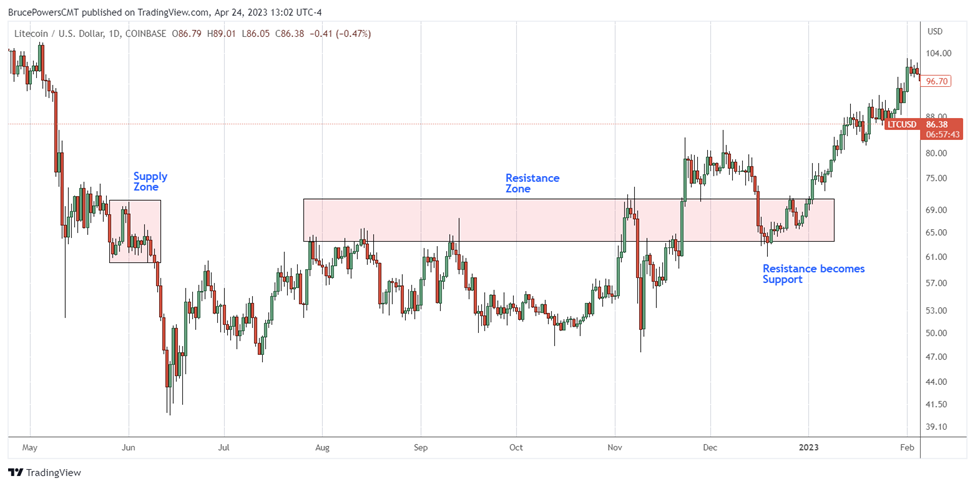
Supply and Demand Zones vs. Support and Resistance Levels
Many traders consider supply and demand zones as resistance or support, respectively. But while both supply and demand zones and support and resistance levels are used to identify key price areas with buying or selling pressure, there are some crucial differences.
Supply and demand zones point to specific price levels with a concentration of either buyers or sellers, resulting in an imbalance between supply and demand. In supply and demand zone trading, traders are looking to identify fresh or recent price action.
Conversely, support and resistance levels are price levels where buyers and sellers have historically entered or exited the market, respectively. In other words, supply and demand zones are fresh or more recent price areas, whereas support and resistance price levels may be recent or current price areas, but are also identified historically.
Supply and demand zones are more useful in trading, given their more recent price action. In contrast, using support and resistance levels can be useful in a broader context for trade or market analysis, but it’s not as helpful for establishing specific trade strategies.
Pros and Cons of Supply and Demand Trading
Pros
Objective: Supply and demand trading is based on objective data, such as price, volume and investor sentiment. This helps reduce the impact of emotions and biases on trading decisions.
Versatile: Supply and demand trading provides a versatile approach to trading, as it can be applied to any market, asset class or time frame.
High accuracy:There are times that the signals may be very accurate for entering and exiting trades. This is because supply and demand trading’s focus is on key price levels where significant buying or selling pressure is likely to occur.
Risk management: By identifying key resistance and support areas, supply and demand trading can help traders manage risk by using it to place appropriate stop-loss orders.
High potential returns: If executed correctly, supply and demand trading can generate high returns due to the favorable risk/reward ratio of trading at key price levels.
Cons
Complexity:Using supply and demand strategies in trading can be a complex process, and traders should have a solid understanding of technical analysis, market dynamics and trading psychology.
Subjectivity: While the data may be objective, the interpretation of that data can be subjective, differing from one trader to another.
Takes time:Supply and demand trading requires significant time and effort to identify key price levels, keep levels up to date, find setups and execute trades.
Inaccurate signals:False signals are possible, and can lead to losses or missed opportunities.
The Bottom Line
Understanding supply and demand zones is crucial for successful trading. Some tips for successful trading with supply and demand zones include differentiating between support and resistance on one hand and supply and demand on the other, recognizing impulse waves emerging from zones, and considering the pros and cons of this methodology. Combining these strategies with other tools and indicators can increase your likelihood of success when trading with supply and demand zones.
#Bybit #TheCryptoArk