
Breakout Trading Strategy: How to Trade Breakouts

Breakout trading is a popular strategy among retail traders in the cryptocurrency market. It involves identifying key support and resistance levels and capitalizing on price movements beyond those thresholds. While the breakout trading strategy can be highly profitable if executed correctly, it comes with risks. This article aims to guide you in mastering the art of trading breakouts, from understanding common breakout patterns to learning how to confirm a breakout and avoid a false breakout.
Key Takeaways:
Trading breakouts involves capturing significant price movements by identifying critical levels of support and resistance, and then anticipating a break of those key levels.
Common breakout patterns include symmetrical triangles, ascending triangles, descending triangles, rectangles and flags.
Traders can confirm breakouts by looking for volume, price and time confirmation, while steering clear of false breakouts by waiting for confirmation, using multiple time frames, and practicing risk management.
What Is Breakout Trading?
Breakout trading is an entry strategy that aims to capture significant price movements that occur when the market breaks through a pivotal level of support or resistance. It’s based on the belief that when an asset's price breaks out of a trading range, it will continue to move in the direction of the breakout. This important trading strategy is often used by traders seeking to profit from volatility and capitalize on the potential for significant gains.
The key to successful breakout trading lies in accurately identifying support and resistance levels and entering the market at the right time. By understanding support and resistance levels, traders can anticipate potential breakouts and position themselves accordingly. However, it’s critical to note that not all breakouts are genuine, and false breakouts can lead to substantial losses if not managed properly.
Support and Resistance
Support and resistance levels are critical components in trading breakouts. Understanding these levels helps traders read the price action on a chart to identify potential breakouts and make informed trading decisions. Let's take a closer look at support and resistance levels.
Support Level
Support refers to a price level at which buying pressure is expected to be robust enough to prevent the price from falling further. It’s sometimes referred to as a “demand zone,” as sellers withdraw and buyers flood in, perceiving that the price is favorable. Support acts as a price floor, indicating a level where demand exceeds supply. When the price approaches a key support level, traders anticipate a potential upward bounce in price or a new trend to the upside.
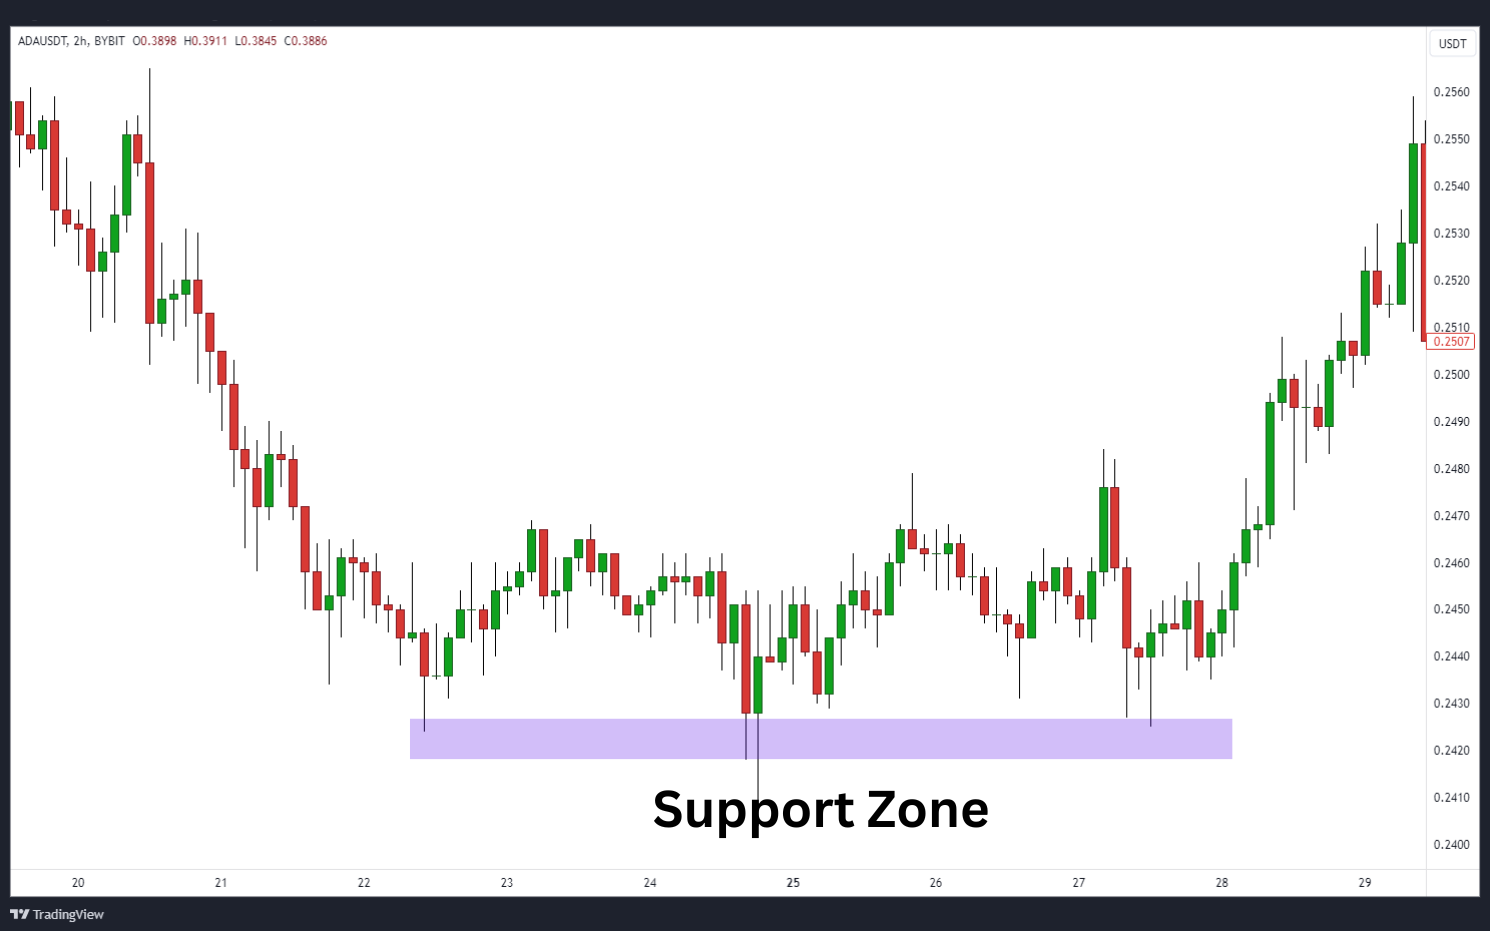
Support levels are typically formed by previous price lows, representing points where buyers have historically entered the market, propelling the price upward. These levels become more significant as more market participants recognize them, and can act as robust barriers preventing further price drops. Traders often look for multiple instances of price bounces or consolidations around support levels in order to confirm their validity.
Resistance Level
Resistance denotes a price level where the selling pressure is presumed strong enough to prevent the price from rising further. It’s sometimes referred to as a "supply zone" as buyers stop buying and sellers start selling. Resistance functions as a price ceiling, indicating a level at which supply surpasses demand. As a price nears the resistance level, traders expect a potential price rejection or a break to the downside.
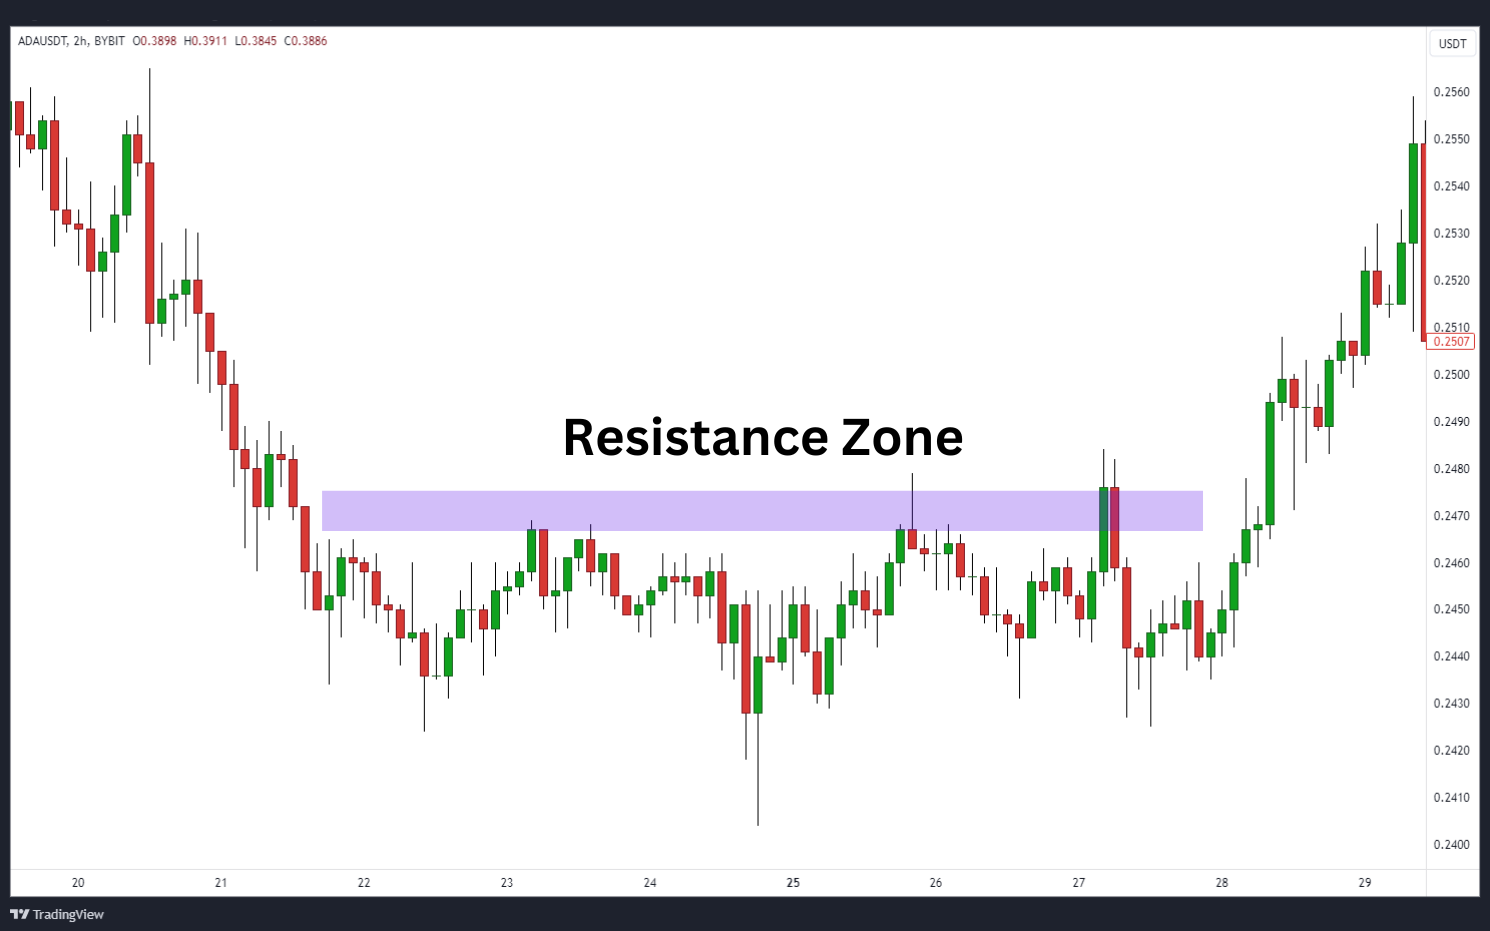
A resistance level usually emerges from past price peaks, representing points at which sellers have historically intervened, causing price declines. As more market participants recognize these levels, their significance intensifies, serving as a formidable barrier to additional price hikes. Traders frequently seek confirmation of a resistance level's validity through multiple occurrences of price rejections or consolidations around that specific level.
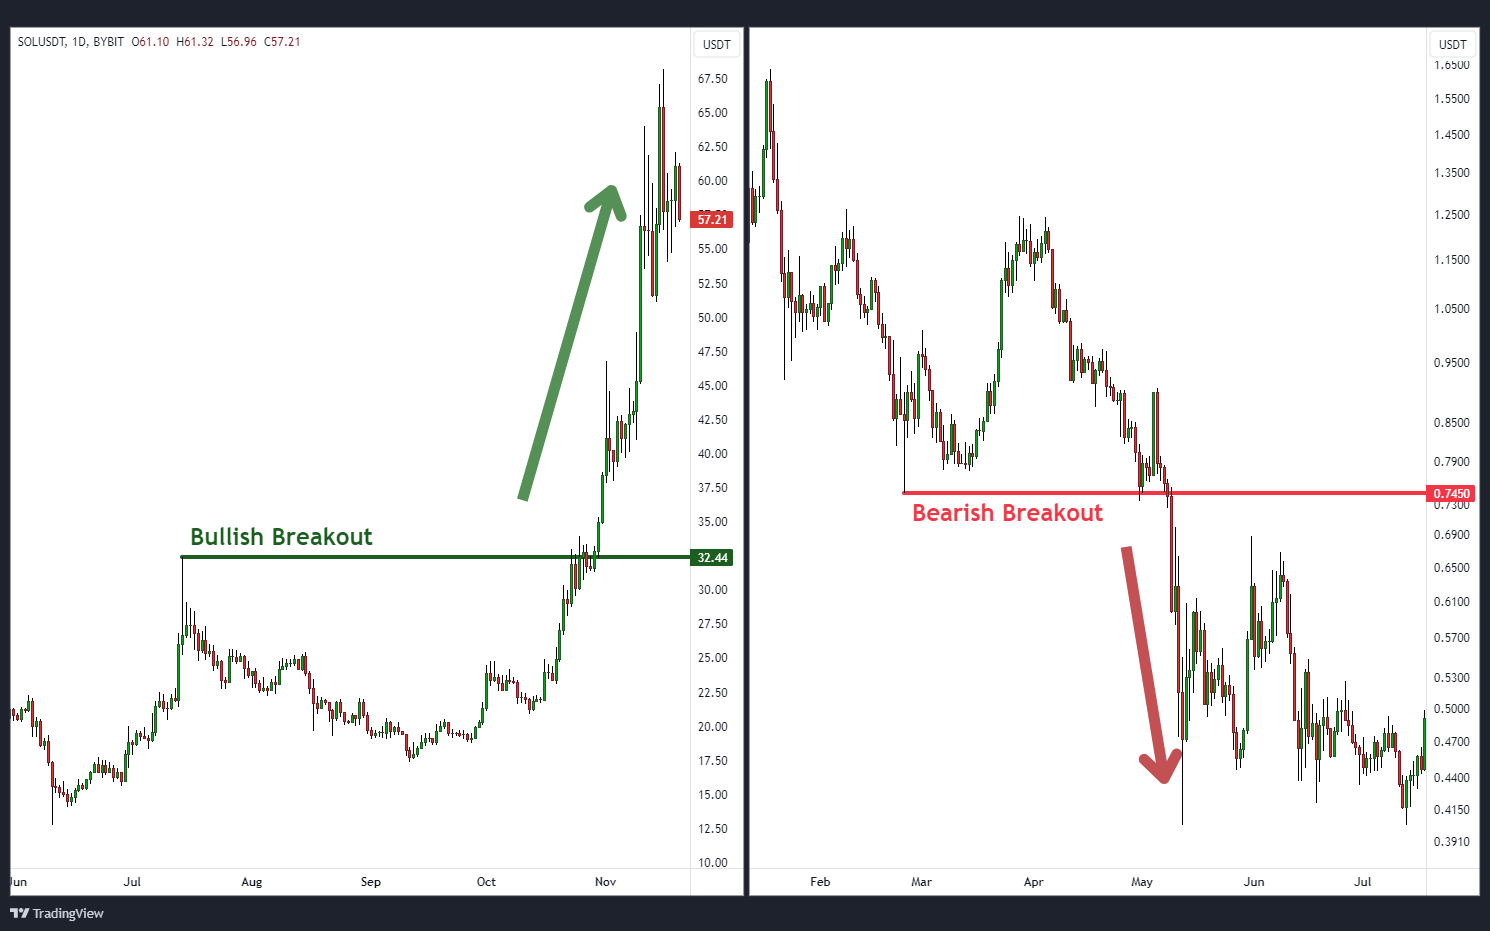
When Does a Breakout Occur?
A breakout occurs when traders anticipate these support or resistance levels will be surpassed, no longer constraining prices. Therefore, breakout traders will aim to buy above resistance and sell below support, unlike most novice traders, who typically buy at support and sell at resistance. This approach may initially seem a little counterintuitive, but breakout traders can effectively estimate potential level breaches using patterns and indicators.
Common Breakout Patterns
Breakout traders look for several common chart patterns when implementing a strategy. These patterns provide valuable insights into potential price movements, and help traders identify entry and exit points.
Below, let’s explore some of the most widely used breakout patterns in cryptocurrency trading.
1. Symmetrical Triangle
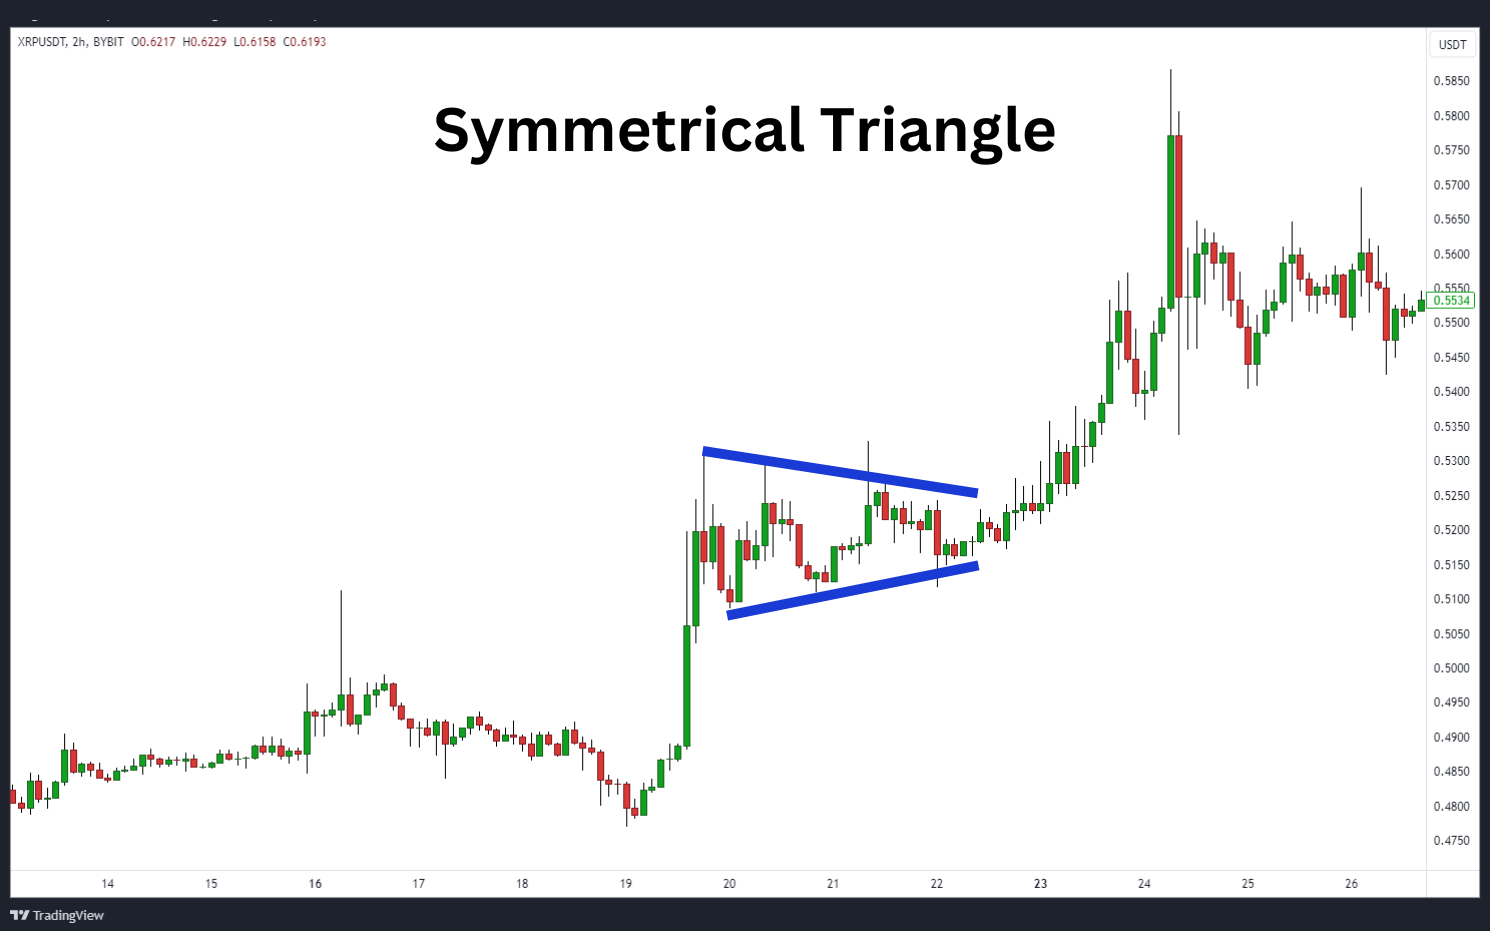
A common chart pattern for breakouts is the symmetrical triangle. This pattern forms when the price consolidates between two converging trend lines, indicating indecision in the market, and often leads to a breakout in either direction. Advanced traders typically see a triangle as a continuation pattern, and anticipate a breakout in the direction of the trend prior to the triangle’s formation. Either way, the best breakout strategy is to wait for the price to break out of the triangle and enter a trade in the direction of the breakout.
2. Ascending Triangle
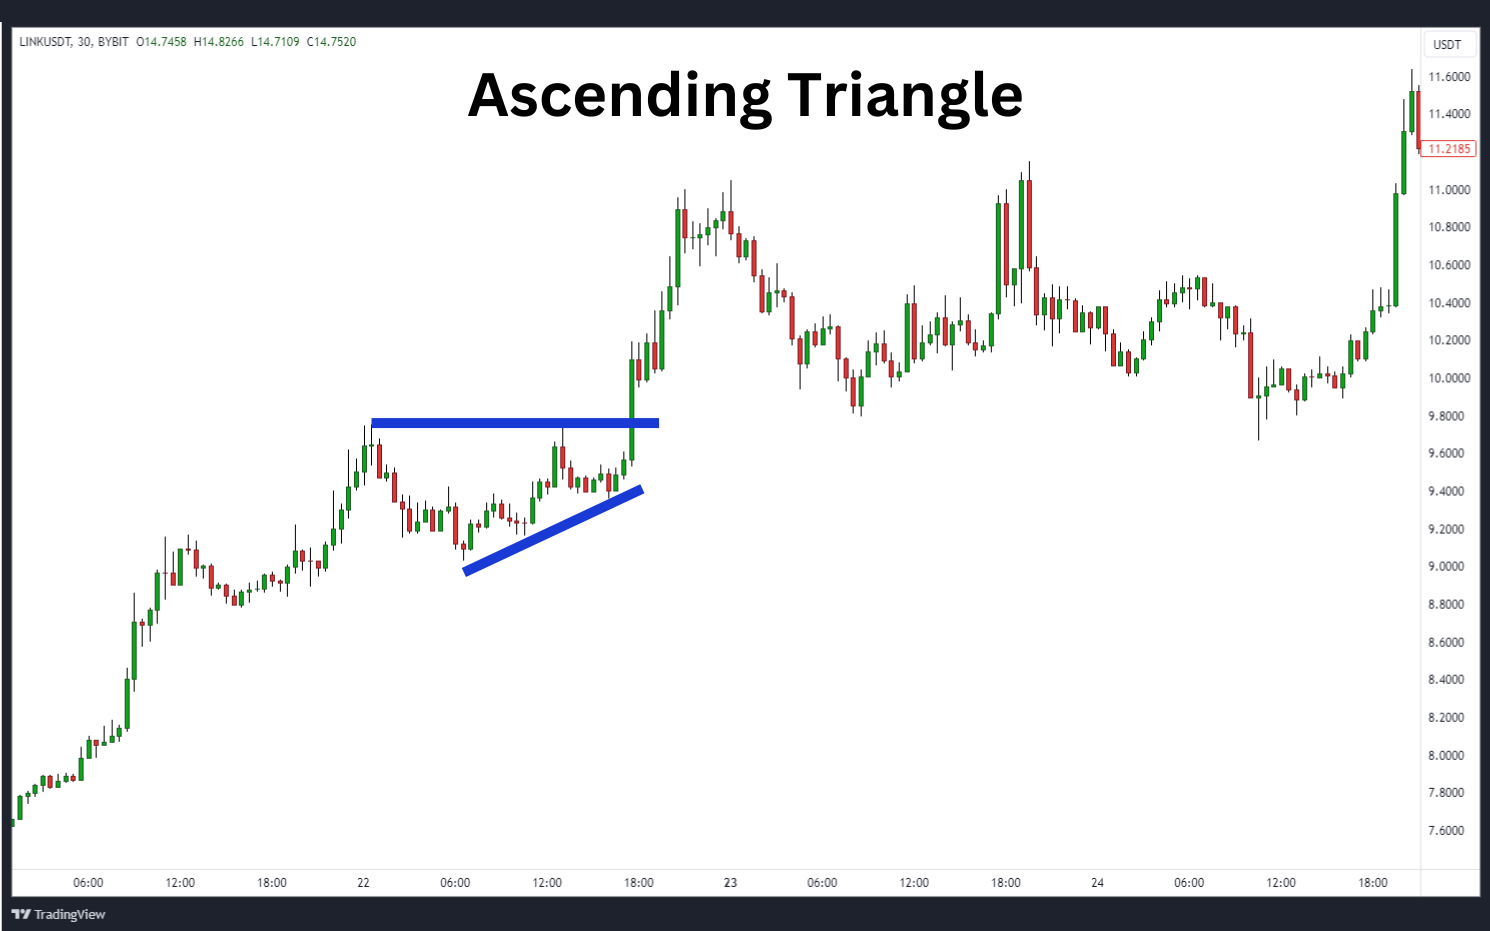
An ascending triangle pattern emerges as the market consolidates, with a horizontal resistance level and an upward-sloping support trend line. This chart formation implies a potential bullish breakout, leading traders to enter long positions when a price breaks above the resistance level.
3. Descending Triangle
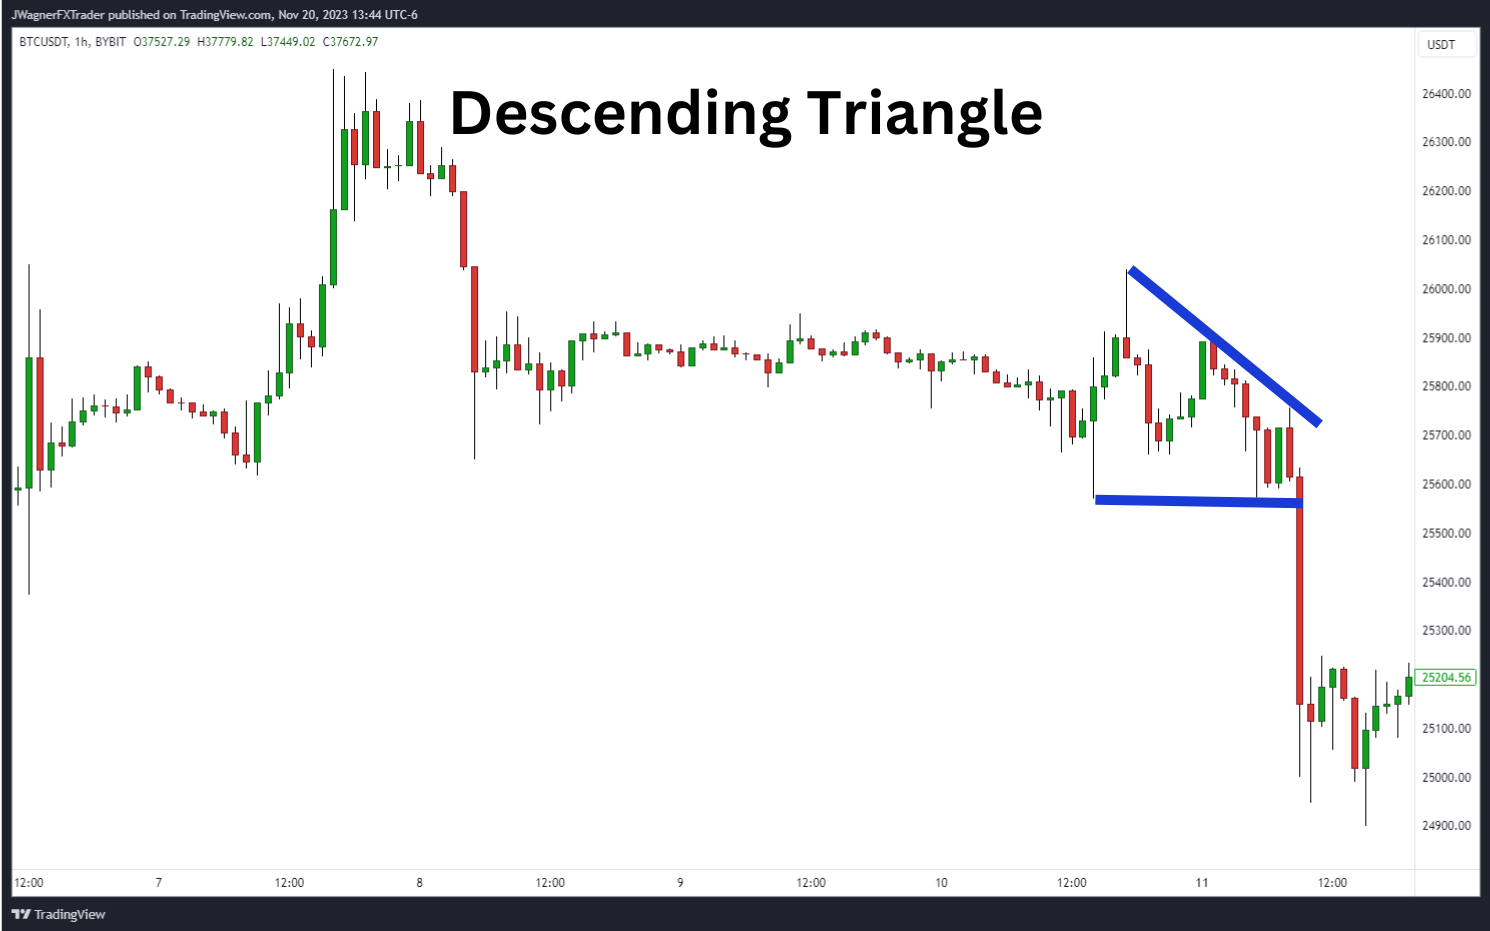
A descending triangle chart pattern is the flip side of the ascending triangle pattern. The descending triangle materializes when a price consolidates, with a horizontal support level and a downward-sloping resistance line. This pattern suggests a potential bearish breakout, prompting traders to initiate short positions with an entry point positioned below the support level.
4. Rectangle
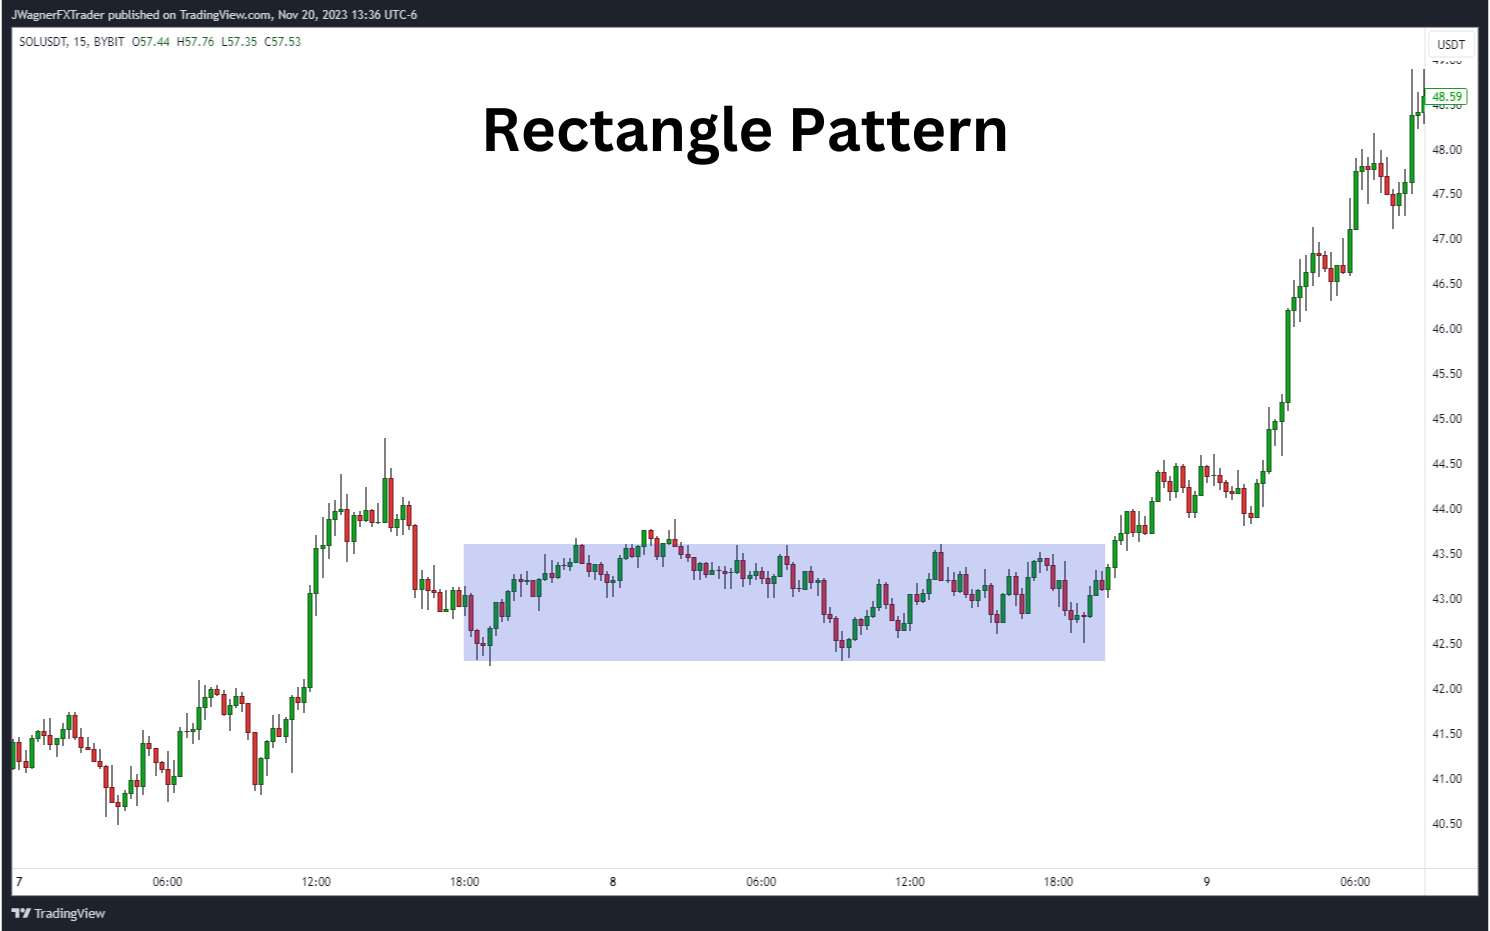
A rectangle pattern develops when the market consolidates between two parallel horizontal trend lines. This pattern indicates a period of consolidation, and traders often wait for a breakout in either direction before executing a trade.
5. Flags
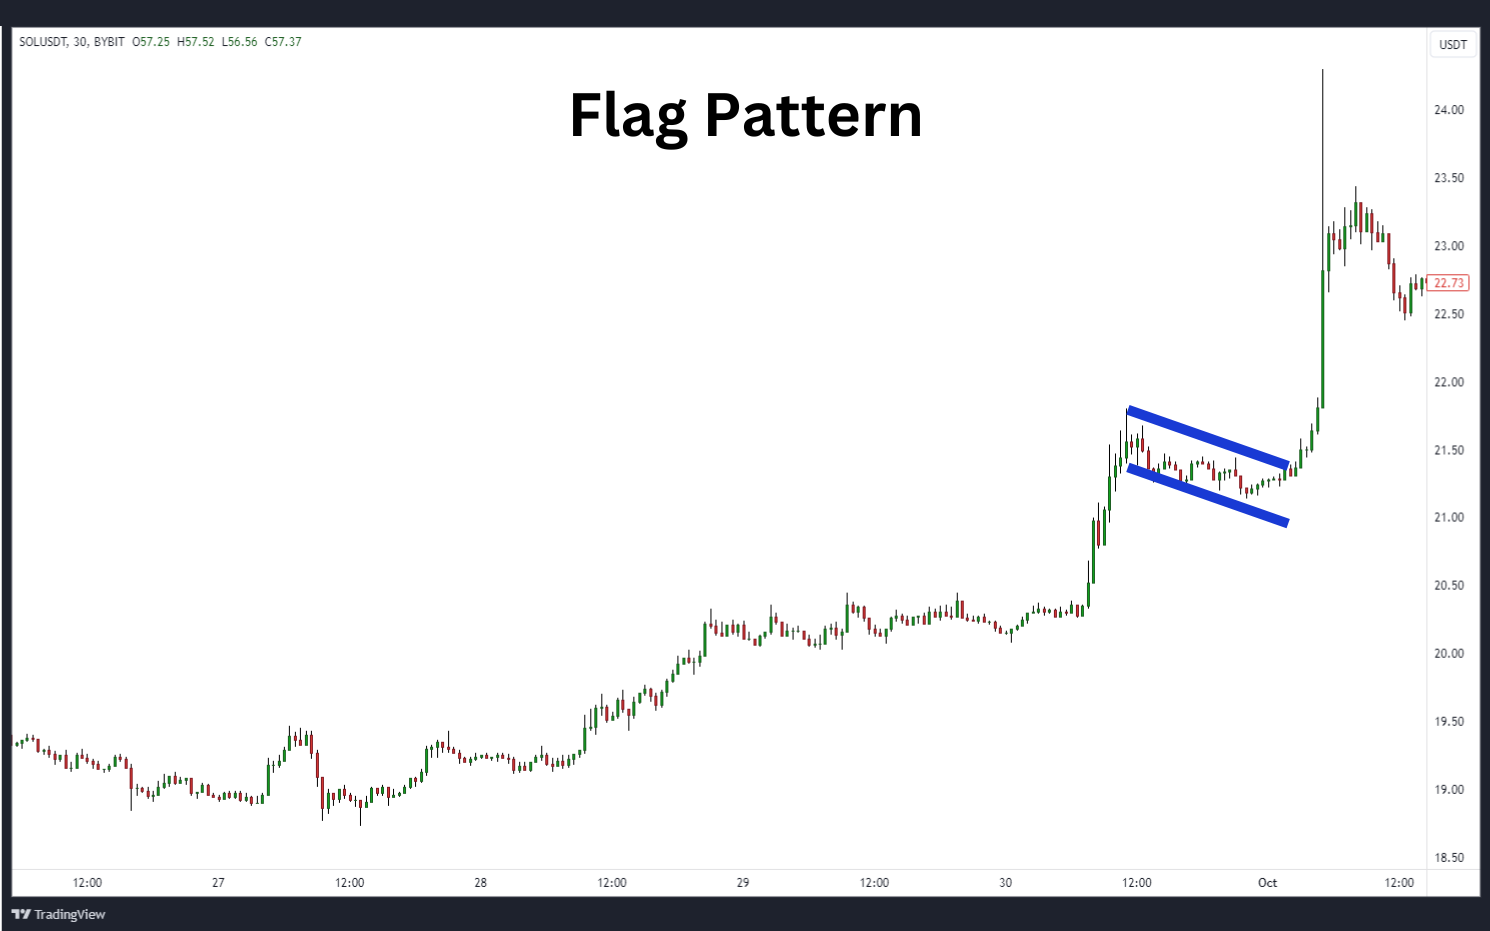
The flag formation is a continuation pattern that features a slight correction against the previous trend. It manifests as a bull flag during an upward-trending market, and as a bear flag during a downward-trending market. Frequently, a robust trend precedes the formation of the flag portion of the pattern.
These are just a few examples of common breakout patterns. Traders should familiarize themselves with other patterns, and learn to recognize them in real-time market conditions.
Best Technical Indicators for a Breakout Trade
Since they help traders confirm potential breakout opportunities, technical indicators play an indispensable role in trading breakouts. Here are some of the best technical indicators that can be used in breakout strategies.
1. Moving Averages
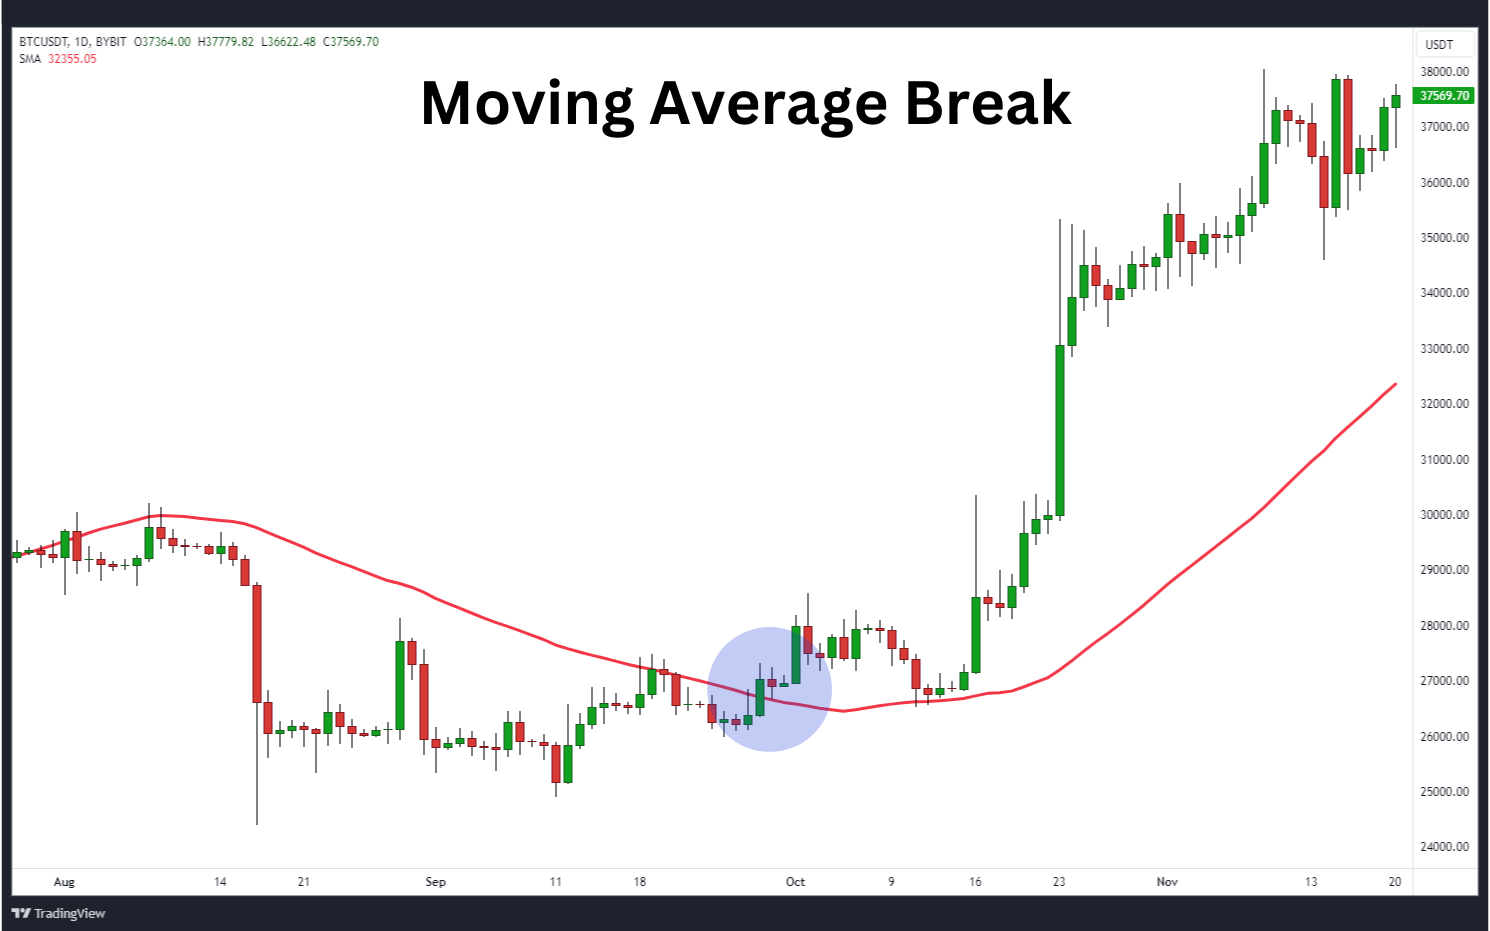
Moving averages (MAs) are widely used in identifying trends and potential breakouts that occur when price action crosses above or below the moving average. For example, if a price crosses above the moving average, it may indicate a bullish breakout, while a cross below the MA may imply a bearish breakout.
2. Bollinger Bands
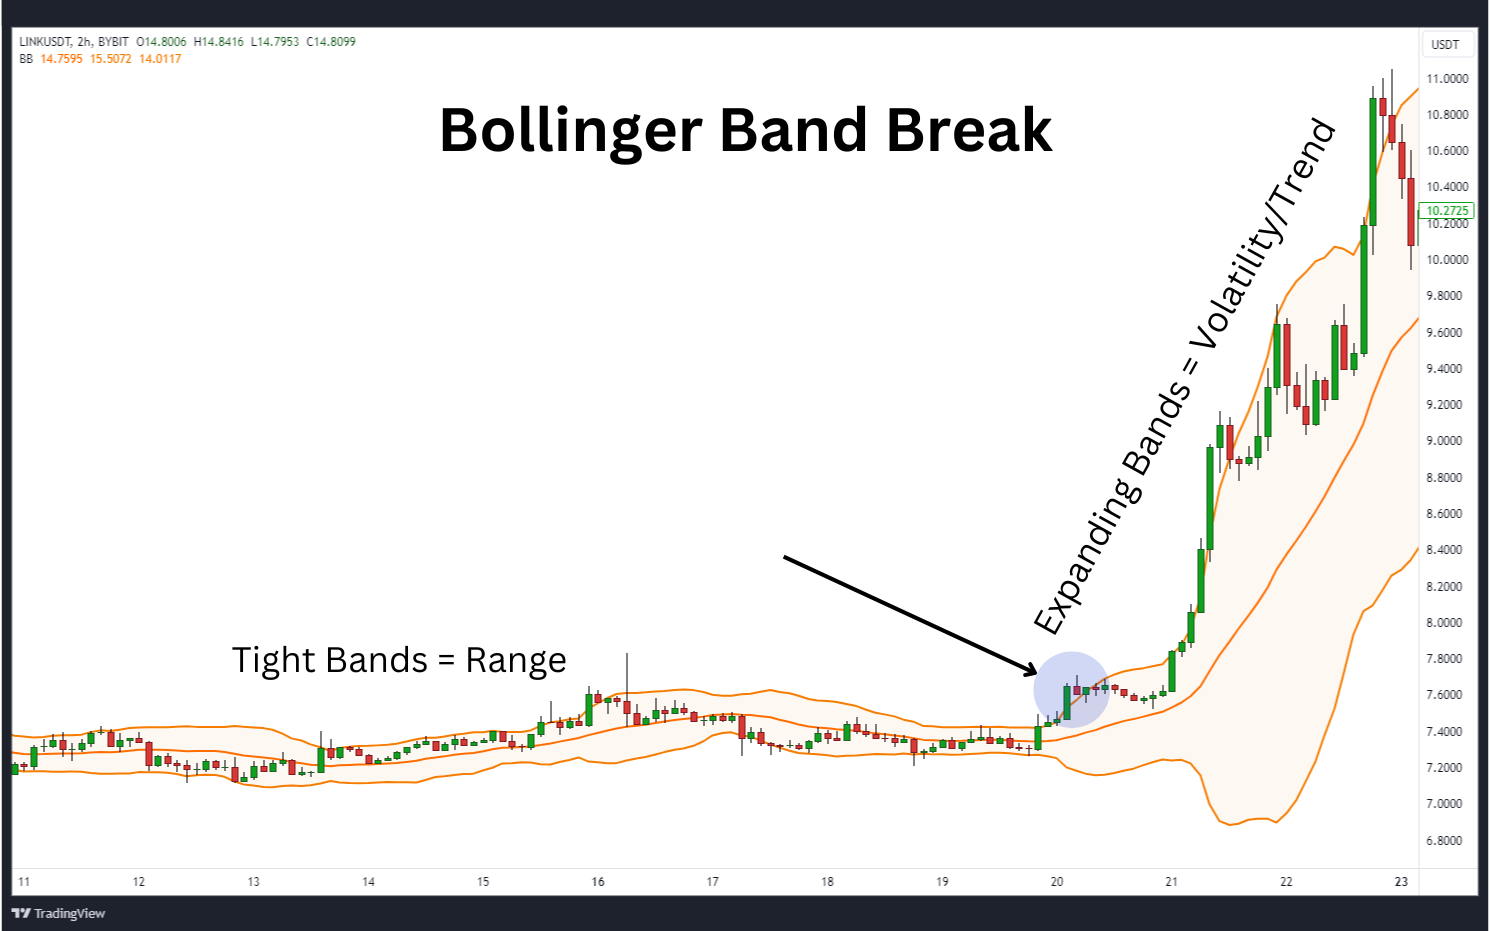
Bollinger Bands® comprise a middle band (usually a simple moving average) and two outer bands that represent the standard deviation of the price. When a price moves outside of the Bollinger Bands, it can indicate a potential breakout. One breakout strategy traders often look for is that of low volatility followed by a sudden expansion of the bands. The expansion of the bands demonstrates increased volatility, a healthy symptom for breakout strategies.
3. Donchian Channels
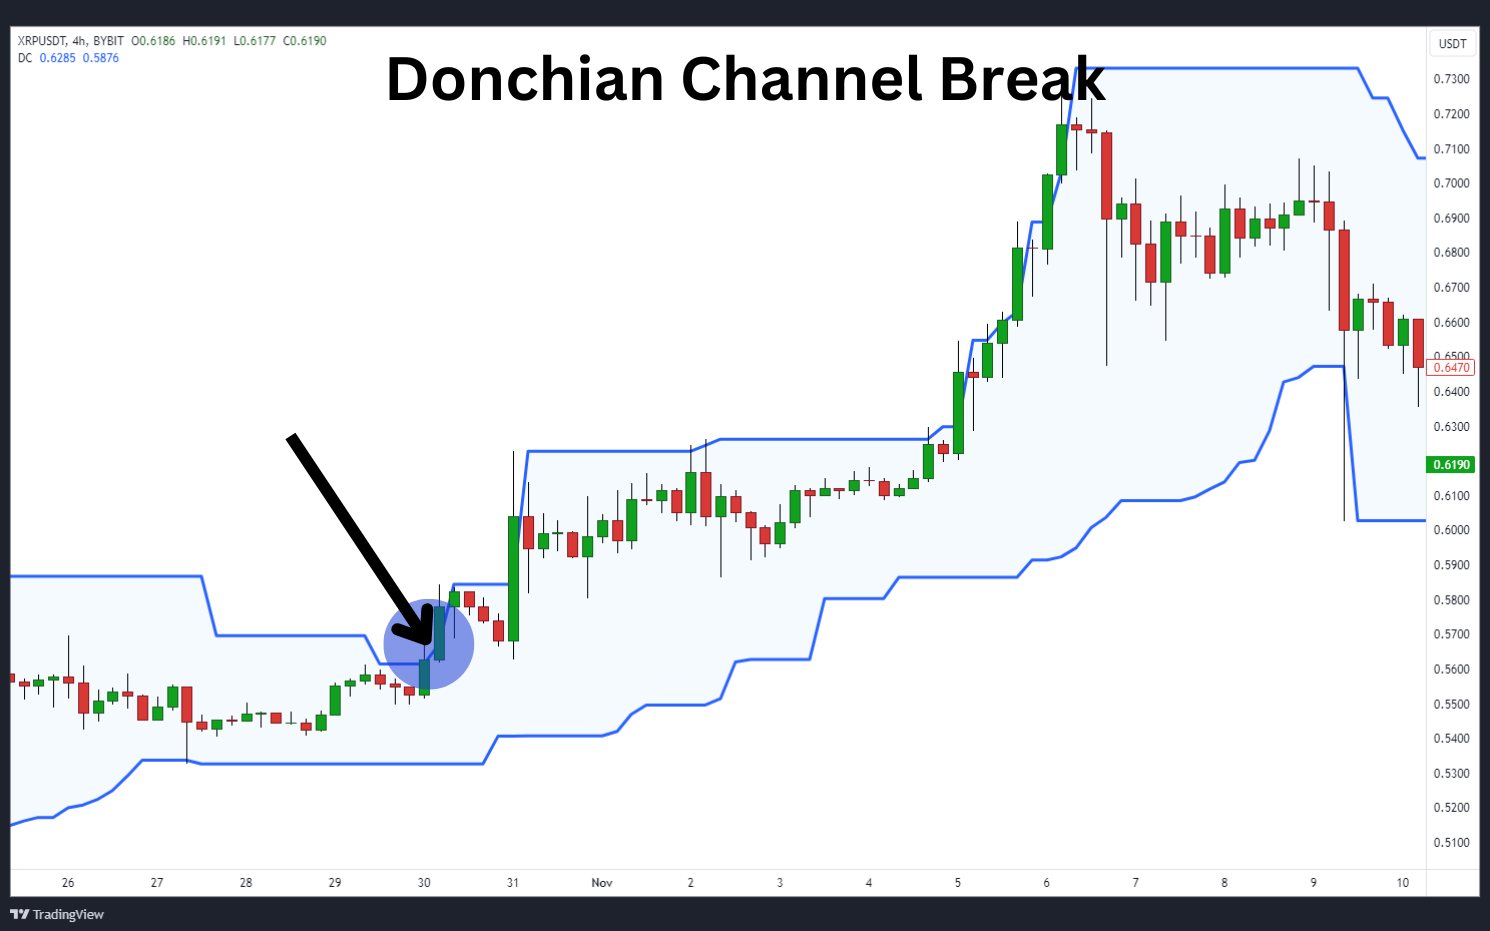
Donchian Channels (DNC) are one of the most popular indicators used in breakout strategies. They delineate an upper limit for the highest high price, and a lower limit for the lowest low price, over a certain number of candles. A breakout occurs when a price surpasses the upper Donchian Channel or falls below the lower Donchian Channel.
4. Volume
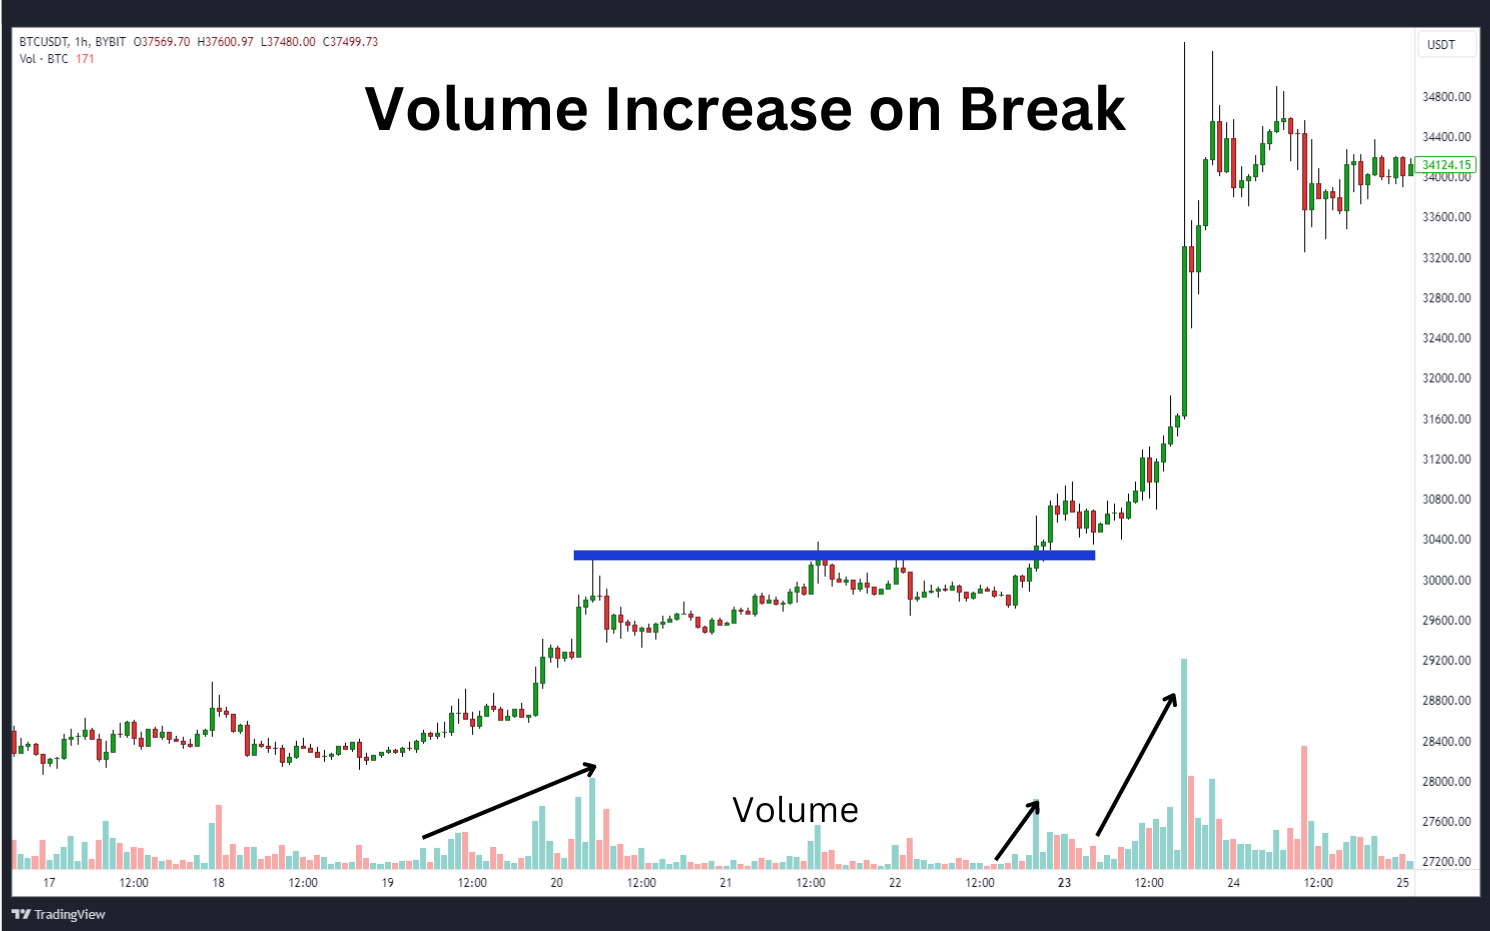
Volume is an essential indicator in a breakout strategy, since it confirms the strength of a breakout. A breakout trade on high volume indicates strong participation and conviction from market participants. Low-volume breakouts are often considered less reliable, and may be prone to false signals.
It’s important to note that technical indicators shouldn’t be used in isolation. Traders need to consider multiple indicators, and analyze them in conjunction with other technical and fundamental factors to bolster the probability of successful breakout trades.
How to Confirm a Breakout
It’s essential to confirm a breakout in order to avoid a false one — as well as to enhance the likelihood of a profitable trade. Here are some techniques that traders can use to confirm when the market breaks:
1. Volume Confirmation — As mentioned earlier, volume plays a vital role in confirming a breakout. Traders should look for high volume during a breakout to validate its strength. An increase in volume suggests strong participation and conviction from market participants, raising the probability of a successful breakout.
2. Price Confirmation —Traders also need to look for price confirmation to validate a breakout. For example, if a bullish breakout occurs, they may want to enter a few points above resistance to help confirm that the breakout is genuine. Similarly, in the event of a bearish breakout, traders may want to see the price continue a couple of points below support before entering.
3. Time Confirmation — Time confirmation refers to the duration of the breakout. Traders are advised to wait until a breakout sustains a certain period before entering. For example, some traders will wait for the candle to close on a breakout before entering. This helps filter out false breakouts and quick reversals that leave behind long wicks on the price charts, ensuring that the breakout has sufficient momentum to generate profitable trades.
With these confirmation techniques, traders can boost their chances of identifying genuine breakouts — and avoid getting caught in false signals.
How to Avoid False Breakouts
A false breakout can be frustrating and result in unnecessary losses. To avert such situations, traders can employ the following strategies:
1.Wait for Confirmation —Traders need to be patient and wait for confirmation before entering a trade. It’s better to miss a potential breakout than to enter a trade prematurely and suffer losses from a false breakout. Waiting for confirmation through volume, price and time can significantly reduce the risk of entering trades during false breakouts.
2.Use Multiple Time Frames —Using multiple time frames can help traders filter out false breakouts. If a breakout is surfacing only on a lower time frame, but not on a higher one, this may signal a false breakout. By analyzing breakouts on multiple time frames, traders can bolster their confidence in the validity of a breakout.
3.Practice Risk Management — Proper risk management techniques are crucial in breakout trading. It’s wise to set appropriate stop-loss orders to limit potential losses in case of a false breakout. Additionally, using position sizing techniques can help manage risk and protect capital.
By incorporating these strategies, traders can minimize the risks of false breakouts and increase their chances of profitable trades.
What’s the Best Time Frame to Trade Breakouts?
The best time frame to trade breakouts depends upon the trader's individual preferences, trading style and availability:
Short-term time frames — such as 5-minute or 15-minute charts — offer a fast-paced trading environment.
Medium-term time frames are for those traders who want to balance the frequency with trades with greater profit potential.
Long-term time frames are best when a trader seeks to capitalize on longer-term trends and breakouts that may last months or years.
Regardless of your chosen time frame, the most crucial concept to remember is that breakouts thrive on volatility. If you’re a short-term trader, make your trades during the times of day when there’s heightened liquidity and volatility in the market. That additional boost of volatility is necessary in order to breach support and resistance levels. For example, short-term traders would do well to stay away from the early part of the Asian trading session on weekends in order to mitigate potential risks.
Pros and Cons of the Breakout Trading Strategy
Like any trading strategy, breakout trading has its own set of advantages and disadvantages. Let's explore some of the pros and cons of breakout trading.
Pros
1. Clear Entry and Exit Points: Breakout trading provides clear entry and exit points, making it easier for traders to plan their trades and manage risk. When a breakout occurs, traders can enter the market at the breakout point and set stop-loss orders at the recent swing to limit potential losses.
2. Trend Following: Breakout trading aligns with the trend-following approach, allowing traders to leverage established market trends. By trading breakouts in the direction of a trend, they can augment their chances of successful trades and potentially ride significant price movements.
3. Versatility: Breakout trading can be applied to various asset classes, including cryptocurrencies, stocks, forex and commodities. This versatility allows traders to explore different markets and diversify their trading portfolios.
Cons
1. False Breakouts: False breakouts can be a challenge in breakout trading. Misidentifying a breakout can result in losses as the price quickly reverses and goes against the trader's position. Traders need to employ proper risk management strategies in order to minimize the impact of false breakouts.
2. Market Noise: In quiet and range-bound markets, breakouts will most likely fail. If the trader doesn’t correctly analyze the current market environment, they may be influenced by market noise and false signals.
3. Emotional Discipline: Breakout trading requires emotional discipline, as traders need to remain patient and wait for confirmation before entering a trade. Impulsive trading or entering trades based on emotions can lead to poor decision-making and result in losses.
The Bottom Line
Breakout trading is a favored strategy among retail traders in the cryptocurrency market, since it offers a systematic approach to capturing significant price movements by identifying key levels of support and resistance. While offering distinct entry and exit points and alignment with trends, breakout trading also carries certain risks, such as false breakouts and market noise. Mastering proper confirmation techniques, adept use of technical indicators and practicing effective risk management are essential steps to achieving success with this strategy.
#Bybit #TheCryptoArk
