
Bitcoin (BTC) Dominance: How It Changes the Way You Trade Crypto


With an exponential increase in the number of available cryptocurrencies, traders are constantly seeking new tools and indicators to discover trends in the crypto market. One such indicator is the Bitcoin (BTC) dominance ratio, which is primarily used to spot possible trends in the altcoin market, bull markets and Bitcoin rallies to identify trading opportunities.
In this article, we’ll be discussing Bitcoin dominance, how it’s derived, factors affecting it — and the potential trading opportunities you can find by using it.
What Is Bitcoin Dominance?
Bitcoin dominance is the ratio between the market capitalization (market cap) of Bitcoin to the market cap of the entire cryptocurrency market. It’s also known as the Bitcoin dominance ratio and Bitcoin dominance index. When we compare this ratio to the trend of Bitcoin itself, we can learn more about opportunities the current market environment offers.
What Is Cryptocurrency Market Capitalization?
For a better understanding of Bitcoin dominance, let’s start with market cap. This term refers to the total market value of a cryptocurrency, and can be calculated by multiplying the number of coins or tokens in circulation by their current market price. For example, given that there are 19,348,206 bitcoins in circulation, and that each Bitcoin is priced at $29,992.29, the total Bitcoin market cap can be calculated using the following equation:
Total Bitcoin market cap = Number of bitcoins in circulation × Bitcoin price
= 19,348,206 × $29,992.29
= $580,297,005,331.74
How Is Bitcoin Dominance Calculated?
Bitcoin dominance can be calculated by taking Bitcoin’s market cap divided by the entire cryptocurrency market cap, thereby giving a percentage value.
At the time of writing (Apr 18, 2023), Bitcoin dominance is calculated to be 45.27% based on the following figures:
Metric | Bitcoin | Cryptocurrency Market |
Market Cap | $580,297,005,331.74 |
This percentage determines the value of Bitcoin to that of the total cryptocurrency market.
Relationship Between Bitcoin Dominance and Market Cap
Bitcoin dominance uses Bitcoin’s market cap and the total cryptocurrency market cap in its calculation.
It’s straightforward to determine and chart both of the figures used in this ratio. Below, we see the Bitcoin market cap (left chart), the total cryptocurrency market cap (middle chart) and Bitcoin dominance (right chart).
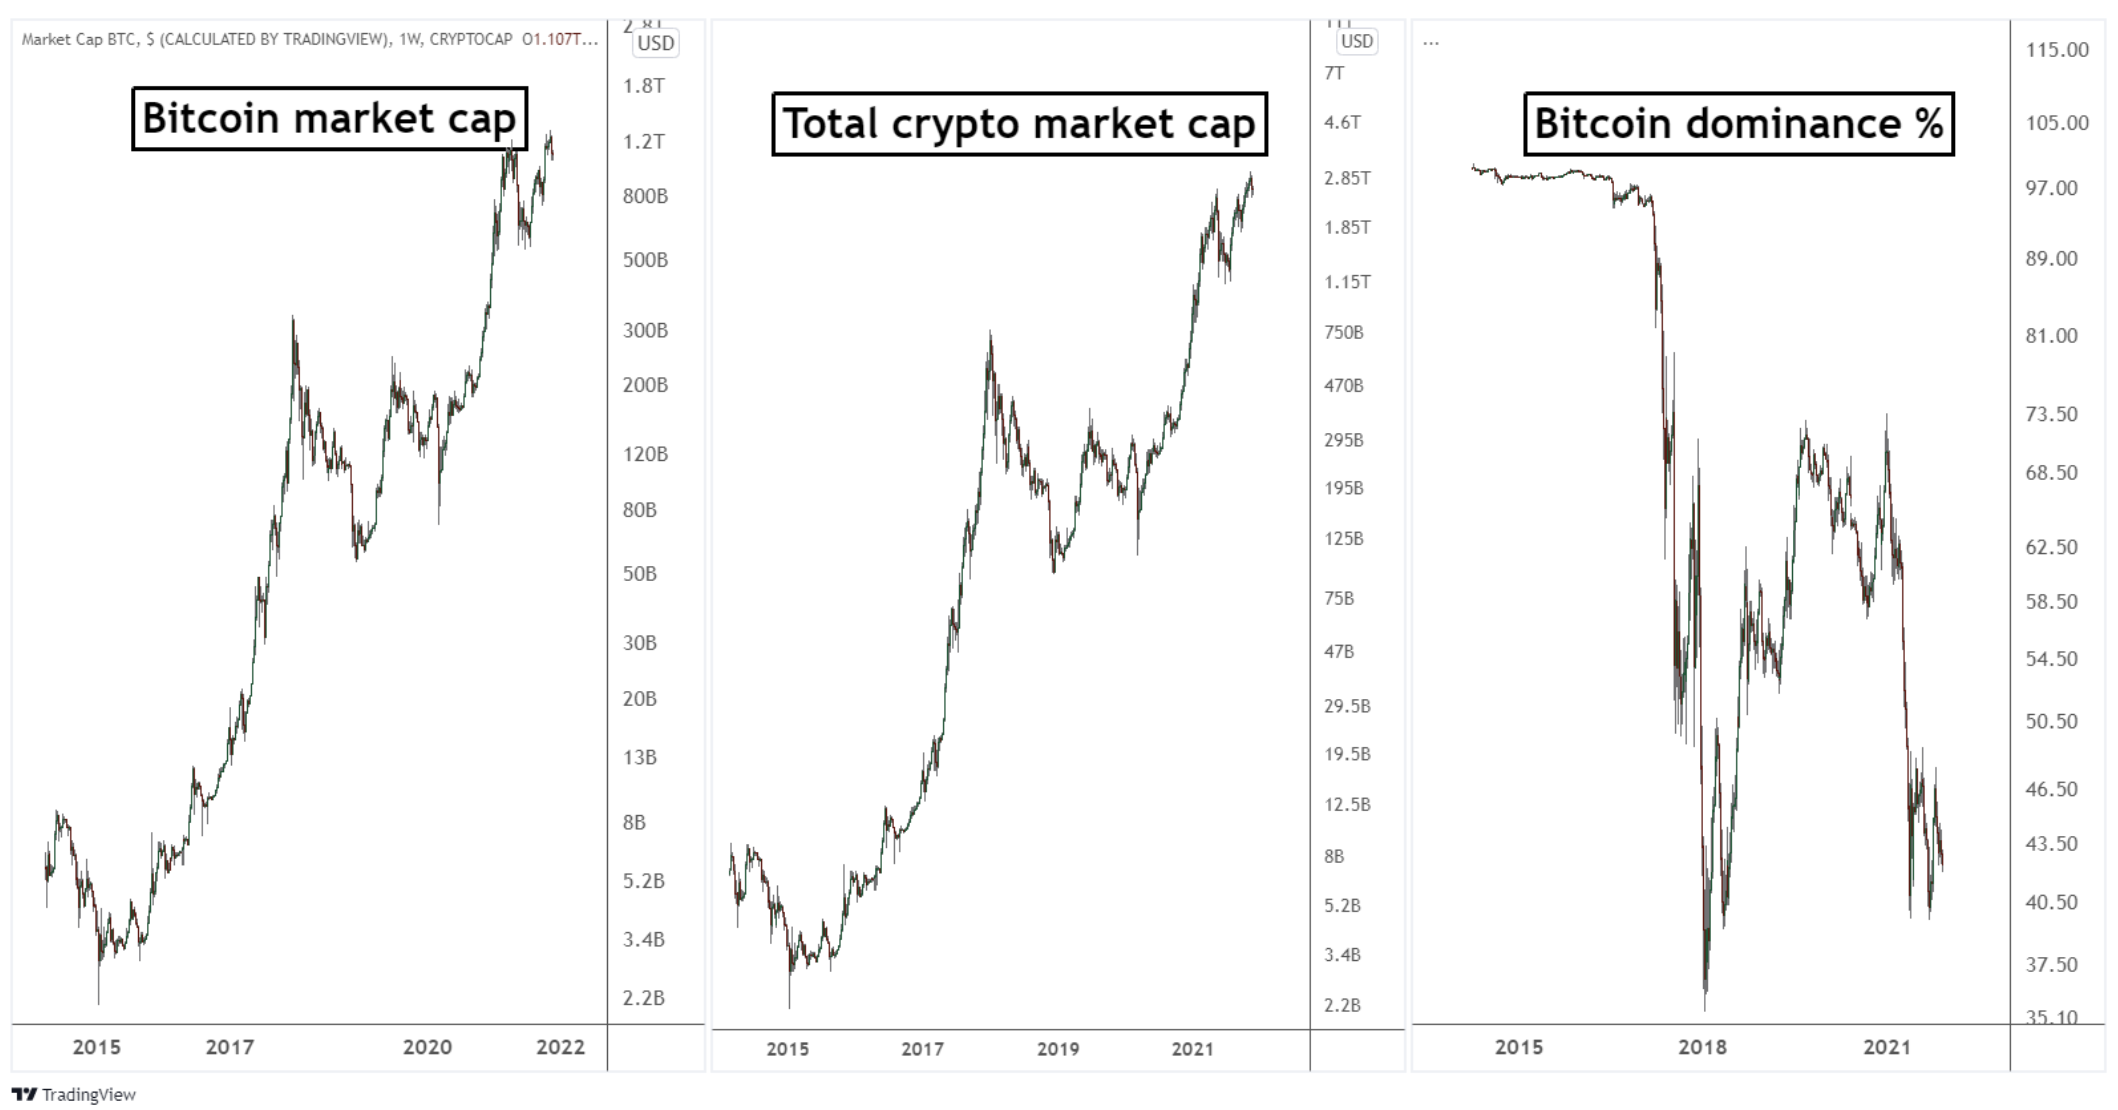
Generally speaking, the shape and direction of the total crypto market cap will follow that of Bitcoin. This is partly due to Bitcoin’s influence over the entire crypto market, since it’s the first, largest and most widely recognized cryptocurrency. Hence, when users look to enter the cryptocurrency market, they typically begin by buying Bitcoin because it’s the most popular cryptocurrency.
Factors That Influence Bitcoin Dominance
Bitcoin started off with a dominance of approximately 99% when it was first created in 2009. Since then, this value has fluctuated dramatically. Here are some of the key factors that affect Bitcoin dominance.
Bitcoin’s Fluctuation in Price
Bitcoin’s market cap represents the numerator of the Bitcoin dominance ratio. Since the number of bitcoins in circulation is fairly steady because only 21 million BTC can be mined, the biggest influence on Bitcoin’s market cap is its price.
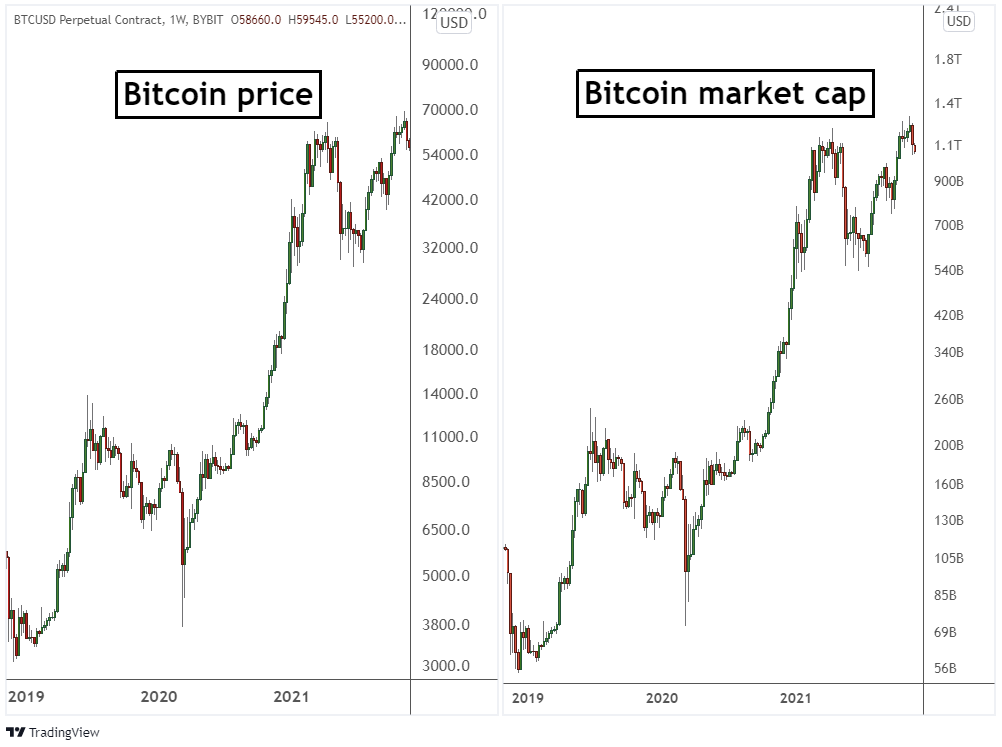
The relationship between Bitcoin’s price and market cap can be seen in the chart above.
Notice that the market cap closely follows and resembles the movement in Bitcoin’s price. As Bitcoin’s price trends higher, its market cap trends higher proportionately.
However, just because Bitcoin’s market cap is trending higher doesn’t mean that Bitcoin dominance is increasing. Bitcoin’s market cap is just the numerator of the ratio. The speed at which Bitcoin’s market cap is moving is compared to the second biggest influencer of the ratio: the altcoin market cap.
Altcoins Fluctuation in Market Cap
The term “altcoins” refers to any cryptocurrency other than Bitcoin. Unlike Bitcoin, which was created to facilitate peer-to-peer payment, altcoins are created for a much more diverse set of use cases. Examples of altcoin use cases include decentralized finance (DeFi), non-fungible tokens (NFTs) and real-world assets (RWA).
Increase in Stablecoin Usage
As the demand for cryptocurrencies increases, more users are entering the cryptocurrency market by minting stablecoins such as USDC, USDT and BUSD. When these stablecoins are minted, their market caps increase, further increasing the total altcoin market cap.
In addition, during volatile market conditions, users may choose to take profit and keep their capital in stablecoins. They may also keep their capital in the form of stablecoins to prepare for deployment into the markets, which decreases Bitcoin dominance.
Market Conditions: Bull or Bear
Bitcoin dominance tends to decrease during bull markets because users are generally more risk-averse and speculative, causing them to deploy their capital into altcoins to capture profits from the upward price movements.
Conversely, users may choose to denominate their assets in Bitcoin during a bear market, looking toward Bitcoin as a form of safe haven. This increases Bitcoin dominance.
New Cryptocurrencies
When new cryptocurrencies are created and enter the cryptocurrency market, they inherently increase the altcoin market cap. Hence, Bitcoin dominance will decrease slightly whenever such cryptocurrencies are launched.
How to Trade Crypto Using BTC Dominance
There are many ways to use BTC dominance to trade. By understanding the ratio between Bitcoin and altcoins, you can identify which category has a stronger trend in order to look for trading opportunities. You can also keep an eye out for the extreme values of Bitcoin dominance to trade.
Strategy 1: Identifying Altcoin Season
“Altcoin Season” describes a period when the price of altcoins increases in comparison to that of Bitcoin. Altcoin Season typically follows after Bitcoin has experienced a significant increase in price, and investors look toward diverting their profits to other cryptos, which kick-starts Altcoin Season.
First, determine the trend of BTC dominance. You can use TradingView’s chart to view the index.
Second, determine the price trend of Bitcoin in a similar time frame.
Finally, use this table to help you determine a strategic bias.
Bitcoin Dominance | Bitcoin’s Trend | Signal |
Ratio in uptrend | Bitcoin in uptrend | Buy Bitcoin |
Ratio in uptrend | Bitcoin in downtrend | Sell altcoins |
Raio in downtrend | Bitcoin in uptrend | Buy altcoins |
Ratio in downtrend | Bitcoin in downtrend | Sell Bitcoin |
Once the bias has been established, you can identify trading opportunities using price action, candlestick patterns and/or other technical indicators.
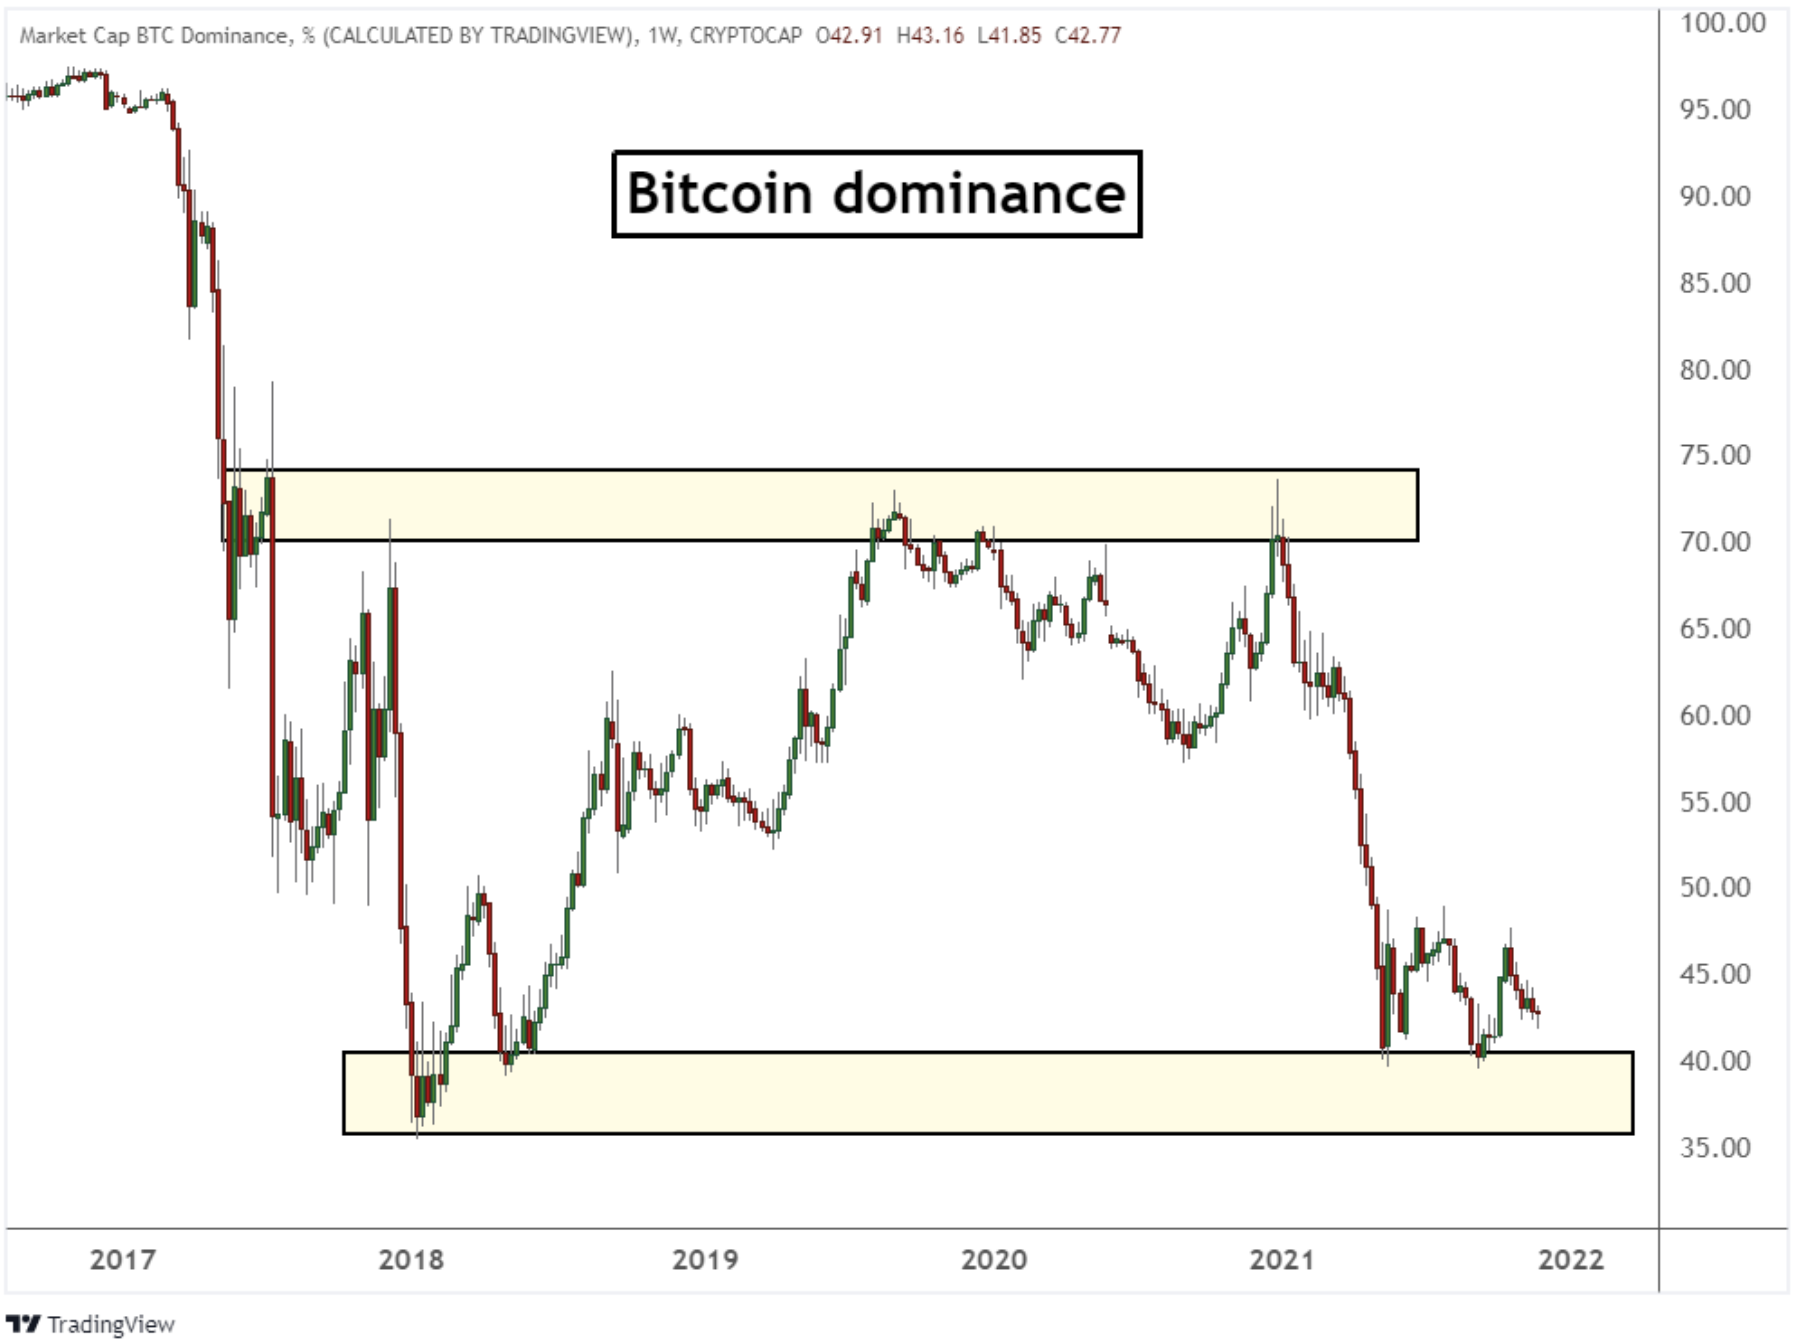
Strategy 2: Trading Extreme High and Low Bitcoin Dominance Levels
Between 2017 (ICO boom) and 2021 (DeFi Summer), Bitcoin dominance reached a high of 75% and a low of 35%. These two values are regarded as the extreme historical Bitcoin dominance levels.
One strategy that traders can employ would be to trade these extremes. When Bitcoin dominance inches toward 75%, there might be an expectation that BTC’s price will fall soon. On the other hand, when Bitcoin dominance decreases and reaches close to historically low levels, you can expect an imminent change in Bitcoin price movement to the upside.
You can use the table above as a guide to determine which markets to focus on when BTC dominance is at risk for a reversal.
Bitcoin dominance seldom reaches these historic highs and lows. However, when the ratio does reach extreme levels, it can offer some good trading opportunities. It’s important to manage your risk because the ratio has been known to breach these levels.
History of Bitcoin Dominance
2009–2016
When Bitcoin was first launched in 2009, the cryptocurrency market was still a small one with relatively few cryptocurrencies available. At that time, Bitcoin dominance was approximately 99%. After four years, in 2013, more cryptocurrencies started to launch, pushing Bitcoin dominance down slightly to 94%.
2017–2018
Things changed drastically in 2017, when Ethereum’s price increase kicked off an initial coin offering (ICO) boom in which thousands of cryptocurrencies were launched into the market. This increase in altcoin market cap was further accentuated, given widespread market participation in such ICOs.
With increasing cryptocurrency prices (from increased user demand), the altcoin market cap rocketed, dropping Bitcoin dominance to 38% in 2018.
2019–2020
Following the drastic decrease in Bitcoin dominance, a bear market followed. Many altcoins from the ICO boom died out, decreasing the altcoin market cap. In the meantime, more people rotated their capital back into Bitcoin, seen as a safe haven in the bear market. These market conditions contributed to recovering Bitcoin dominance.
2021
DeFi Summer arrived in 2021, and the yields offered by the altcoin market prompted traders to shift their capital into altcoins. This drastically increased the altcoin market cap, reducing Bitcoin dominance to below 50%.
2022
During the year of 2022, Bitcoin dominance hovered between 40% to 50%. With the utility brought about by altcoins, including real world assets (RWA) and DeFi applications such as GMX, the market still had the bulk of their capital allocated to such yield generating cryptocurrencies. As a result, the capital hardly rotated back into Bitcoin, resulting in the Bitcoin dominance being relatively stagnant.
Shortcomings of Bitcoin Dominance
Despite being a popular indicator, Bitcoin dominance has received its fair share of criticism.
Constantly Increasing Cryptocurrency Market Cap
As mentioned earlier on, Bitcoin dominance trends downward when new cryptocurrencies are being launched. Given that new protocols and projects are consistently being built and launched, there has been criticism regarding the reliability of Bitcoin dominance over the long term.
Limitations of Market Cap Metric
There have been concerns that the Bitcoin market cap is actually lower than calculated. This is because a portion of the Bitcoin supply might be lost, or sitting abandoned in old wallets.
Given the complexity of the cryptocurrency market, it’s not recommended that you rely solely on Bitcoin dominance to determine your trading strategy. By combining Bitcoin dominance with other indicators, you may be able to better identify market trends.
The Bottom Line
Bitcoin dominance ratio is an excellent tool to help users understand trends within the cryptocurrency market. By looking at the Bitcoin dominance ratio, coupled with Bitcoin prices, you can potentially identify market trends and decide on a trading strategy.
As mentioned earlier on, there are some shortcomings to using the Bitcoin dominance indicator. Therefore, consider using this indicator alongside others in order to better identify market trends and trading opportunities.
#Bybit #TheCryptoArk