
Weighted Moving Average (WMA): What It Is and How to Use It

Moving averages are technical indicators that allow traders to understand trends and shifts in the market. They assist in identifying potential price movements, indicating both upward and downward directions, and highlighting potential points of reversal or stabilization. Among the various types of moving average indicators, weighted moving average (WMA) is particularly useful because it pays extra attention to recent prices and doesn't treat all prices the same. This helps traders better comprehend market dynamics and make informed decisions regarding buying or selling.
Key Takeaways:
Weighted moving averages are exceptionally sensitive to short-term market fluctuations as they prioritize recent data points, enabling traders to promptly identify evolving trends.
The weighted moving average often acts as a dynamic support and resistance area, guiding traders in setting optimal entry and exit points.
Weighted moving averages can furnish timely signals for potential trend reversals as the price crosses above or below the average price, alerting traders to potential shifts in market sentiment and prompting them to consider adjustments to their positions.
What Is Weighted Moving Average (WMA)?
Weighted moving average (WMA) is a technical analysis tool used by traders to analyze trend direction and identify potential areas of price support and upward rallies, or to pinpoint instances where prices may be elevated and trending downward.
WMA falls under the broader category of moving averages, which are some of the most popular tools used by crypto traders for understanding market trends and potential price reversals. Unlike a simple moving average (SMA), which gives equal weighting to all data points within a specified time frame, a weighted moving average assigns different weights to past data points.
A weighted moving average’s most recent data points are given a higher weighting factor, while older data points receive progressively lower weights. This means that the most recent price points have a more significant impact on the average’s calculation, reflecting the current market sentiment more accurately.
Weighted moving average is versatile, and can be applied to any crypto chart on any chart time frame. Generally, most traders apply the moving average to hourly, daily or weekly charts to determine trend direction. Regardless of the time frame, this weighting factor allows a WMA to react more sensitively to recent prices, making it a valuable tool for traders trying to catch early trend reversals.
How to Calculate Weighted Moving Average (WMA)
Calculating a WMA involves a multi-step process that assigns a weighting factor to different data points, based on their chronological order. This process allows the weighted average to give more importance to recent prices while still considering the historical data set. Follow the steps below to compute a WMA:
1. Determine the Moving Average Time Frame: Choose a specific time frame for your moving average. This could be any period, such as 10 days, 20 days or any other time frame that aligns with your trading strategy. In the following example, we’ll use a 5-period WMA.
2. Assign Weights: Assign weights to each data point within the chosen time frame. The corresponding weighting factor typically decreases as you move further back in time, and the weighting scheme is to list the number of periods and add them together. For a 5-period WMA, the total weight is 15.
5 + 4 + 3 + 2 + 1 = 15
The latest data point is assigned the highest weight at 5/15, followed by the second most recent data point with a weight of 4/15. Subsequent data points receive progressively diminishing weights.
Date | Closing Price | Weighting |
Aug 1 | $23,912 | 1/15 |
Aug 2 | $22,698 | 2/15 |
Aug 3 | $22,750 | 3/15 |
Aug 4 | $24,854 | 4/15 |
Aug 5 | $25,649 | 5/15 |
3. Calculate the Weighted Values: Multiply each price data point by its corresponding weighting factor. For instance, if you’re calculating a 5-day WMA for Bitcoin (BTC), which had the following closing prices, here’s how the weighting is measured:
Date | Closing Price | Weighting Ratio | Total Weighting |
Aug 1 | $23,912 | 1/15 | $1,594.13 |
Aug 2 | $22,698 | 2/15 | $3,025.40 |
Aug 3 | $22,750 | 3/15 | $4,550.00 |
Aug 4 | $24,854 | 4/15 | $6,627.73 |
Aug 5 | $25,649 | 5/15 | $8,549.67 |
4. Sum the Weighted Values: Add up the total weighted values calculated in the previous step to get the sum of the weighted values that make up the weighted moving average.
WMA = $1,594.13 + $3,025.40 + $4,550.00 + $6,627.73 + $8,549.67
WMA = $24,346.93
As new data becomes available, repeat the above steps for the new data set to calculate the WMA for the next period. Then, update the weighted values and their sum accordingly.
Fortunately, most trading platforms and charting software offer built-in tools for calculating WMAs, so traders don't always have to perform these calculations manually. However, it’s important to understand how the calculation works so you can better comprehend why it’s useful for you.
How to Trade Weighted Moving Average
One reason why moving averages are so popular is that they’re versatile and easy to use. Below are two strategies that traders might employ when trading the WMA.
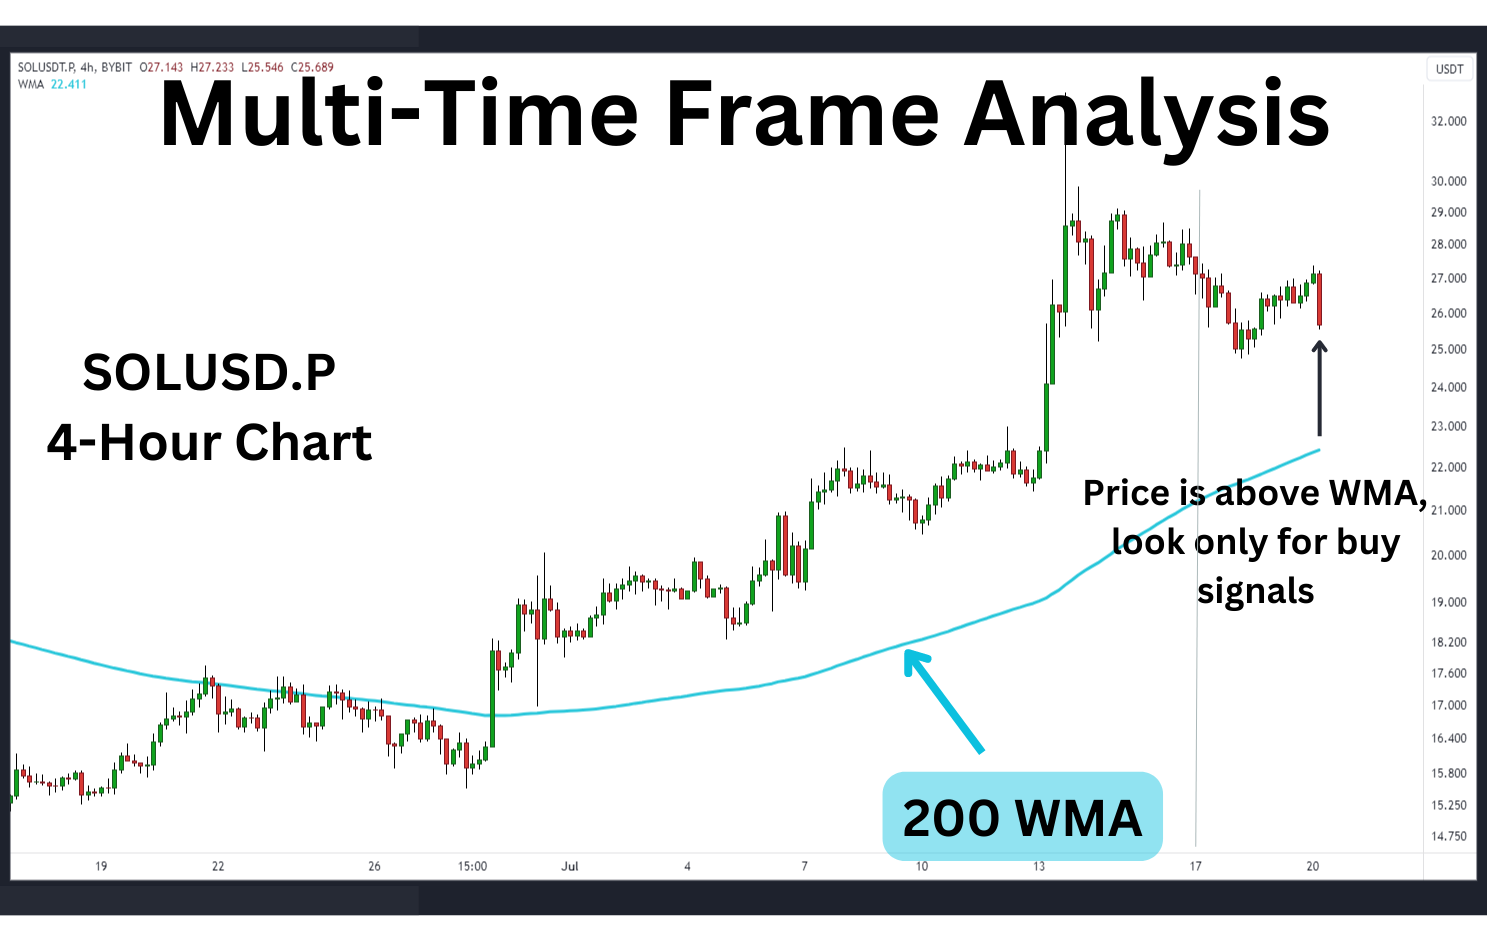
1. Trend Filter in Multiple Time Frame Analysis
Multi-time frame analysis is a method for using different chart time frames to spot trading opportunities.
As an example, determine the direction of the trend on the daily or 4-hour chart time frame. Apply the 200 WMA and observe where the current price is. If it’s above the moving average, look only for buy signals, and if it’s below the moving average, then look only for sell signals.
Next, scale down to a 1-hour chart time frame and look for a signal from a technical indicator that aligns with the larger trend. For example, if the trend is up, then look for a bullish stochastic signal to buy. Conversely, watch for a bearish stochastic signal to sell if the trend is down.
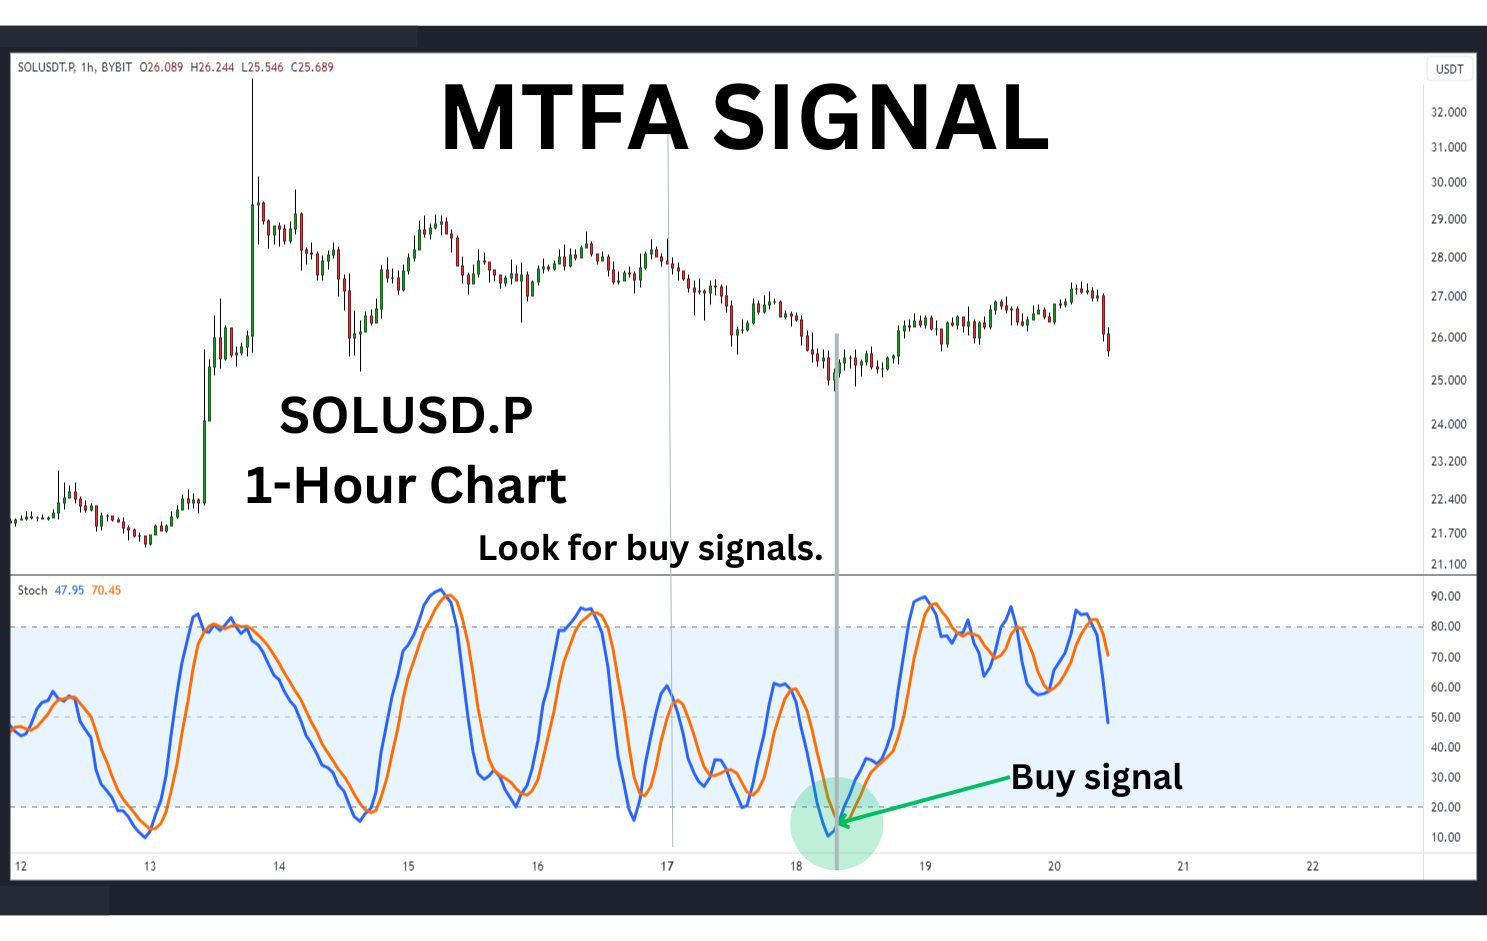
Initiate the trade and place a stop loss just under the lowest point of the swing for a buy trade, or just above the highest point of the swing for a sell trade. Aim for a target at least twice the distance to the stop loss to maintain a risk-to-reward ratio of at least 1:2.
2. Use the Weighted Average as Dynamic Stop Loss
Given the WMA’s greater emphasis on near-term pricing, some traders employ it as a stop loss in momentum trades. For example, if the 10-day weighted moving average crosses above the 50-day moving average, a trader may decide to buy Ripple (XRP) in anticipation that the trend will sustain a strong upward trajectory. Rather than establishing a take-profit limit order, the trader will dynamically monitor the market by utilizing the 50-day WMA as a trailing stop loss.
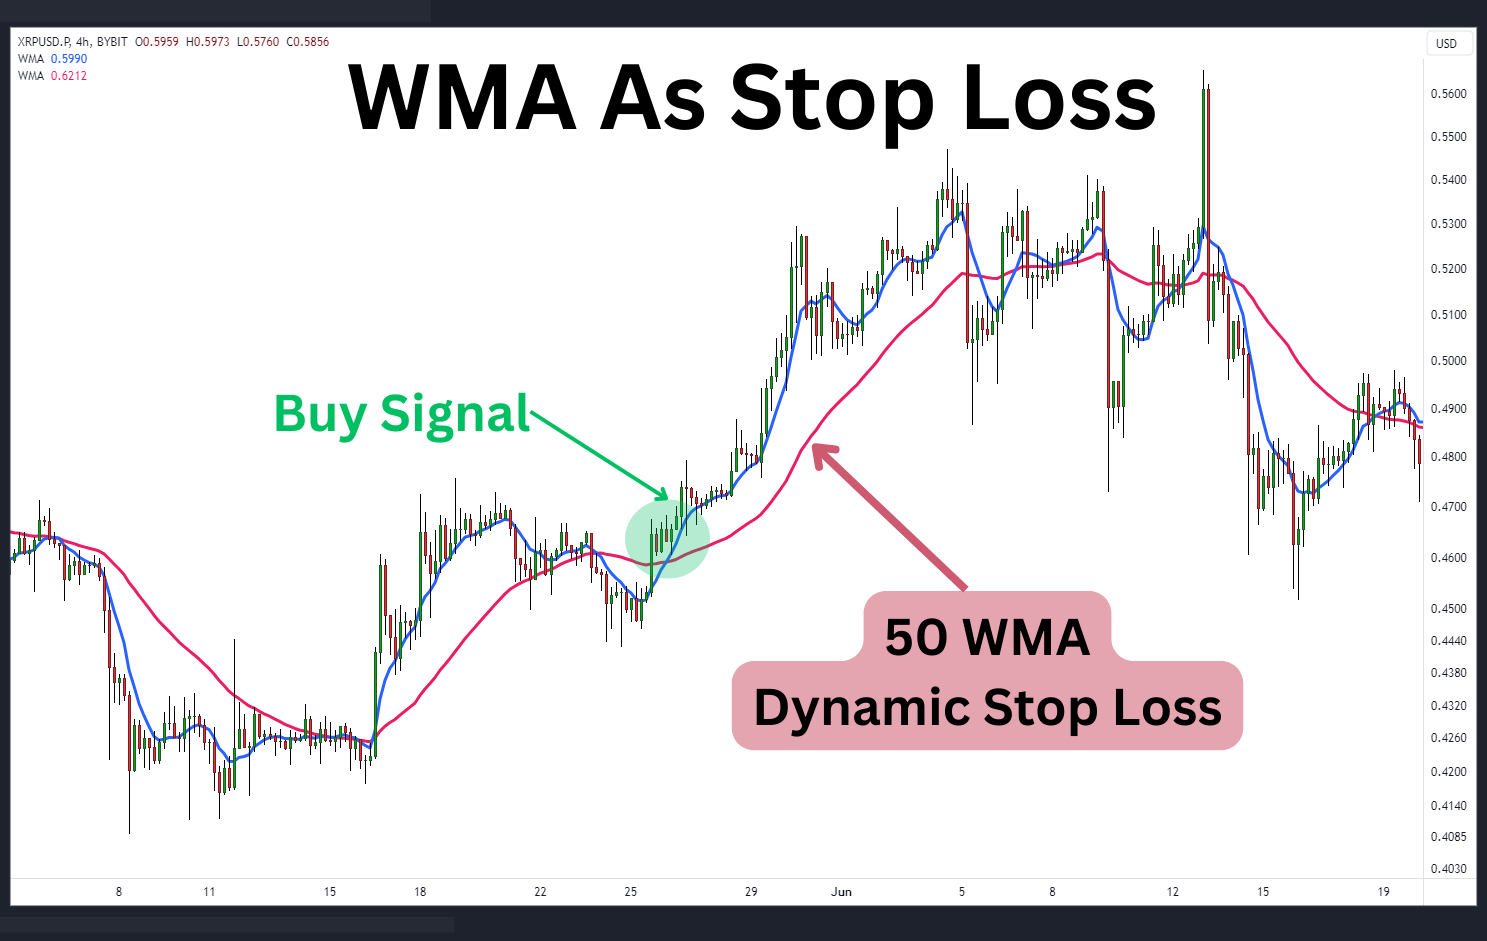
If prices touch and breach the 50-day WMA, then the trade would be closed. The advantage to this strategy is that if the trend continues without hitting the stop loss, the 50-day moving average will eventually ascend beyond the entry price, effectively securing a profitable trade.
Pros and Cons of Weighted Moving Average
Pros
Sensitivity to Recent Trends: WMAs are particularly effective at capturing short-term price movements due to their emphasis on recent data. Traders specializing in short-term trading strategies find the weighted moving average helpful in identifying quick changes in market sentiment, as well as trend direction changes.
Timely Reversal Signals: Since a WMA reacts swiftly to recent prices, it can provide timely signals about support and resistance areas. This can help traders enter or exit positions at opportune moments, thereby maximizing profits and minimizing losses.
Customizable Time Frames: Traders can adjust the time frame for a WMA, tailoring their analysis to suit different trading styles and strategies. This flexibility allows traders to adapt the weighted moving average to various market conditions and time horizons.
Cons
Greater Noise: While the sensitivity of the WMA is an advantage in capturing short-term trends, it can also lead to increased noise and false signals. Traders need to be cautious and use additional indicators or tools to confirm signals generated by WMAs.
Lagging Behind Rapid Price Movements: Despite their emphasis on recent data, WMAs may still lag behind exceptionally rapid price movements, potentially causing traders to miss out on certain opportunities.
Limited Applicability in Certain Markets: If market conditions change from quiet to volatile, the WMA will become less effective. Market turbulence often results in less significant movements of the average price, consequently increasing the likelihood of false signals.
The weighted moving average is an extremely versatile tool that offers traders sensitivity to short-term price movements and timely reversal signals in a smooth and predictable market. Its customizable time frames can be adjusted to suit different trading styles, although traders should be aware of potential noise and false signals.
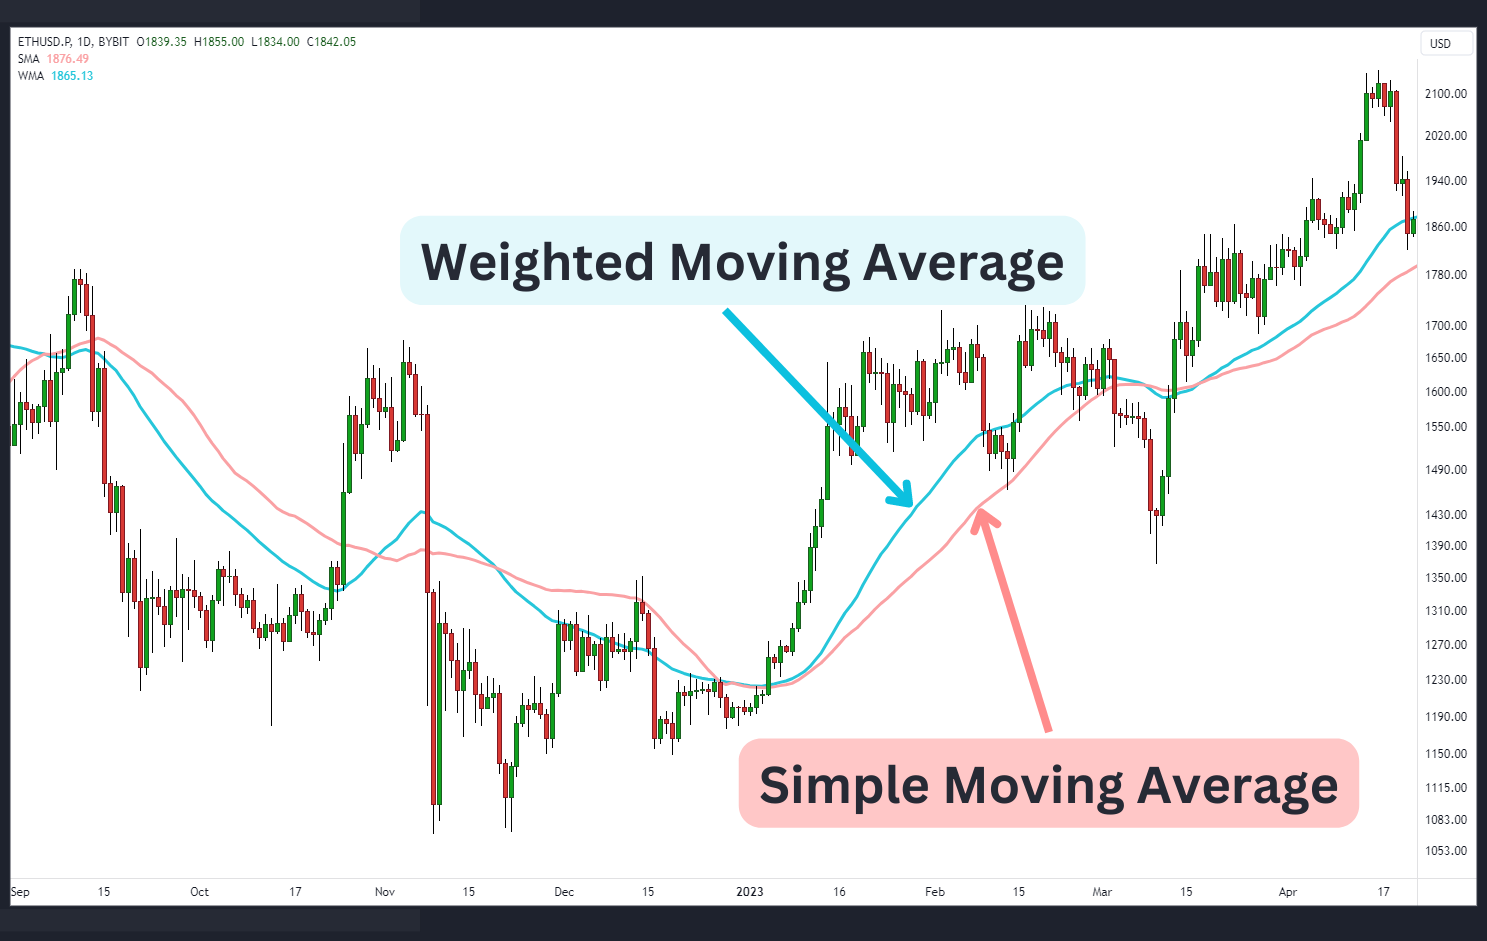
Weighted Moving Average (WMA) vs. Simple Moving Average (SMA)
Weighted moving average (WMA) and simple moving average (SMA) are both commonly used technical indicators in trading and chart analysis, each with its own unique characteristics and applications. Understanding the difference between these moving averages is crucial so you can determine when it's best to utilize one or the other.
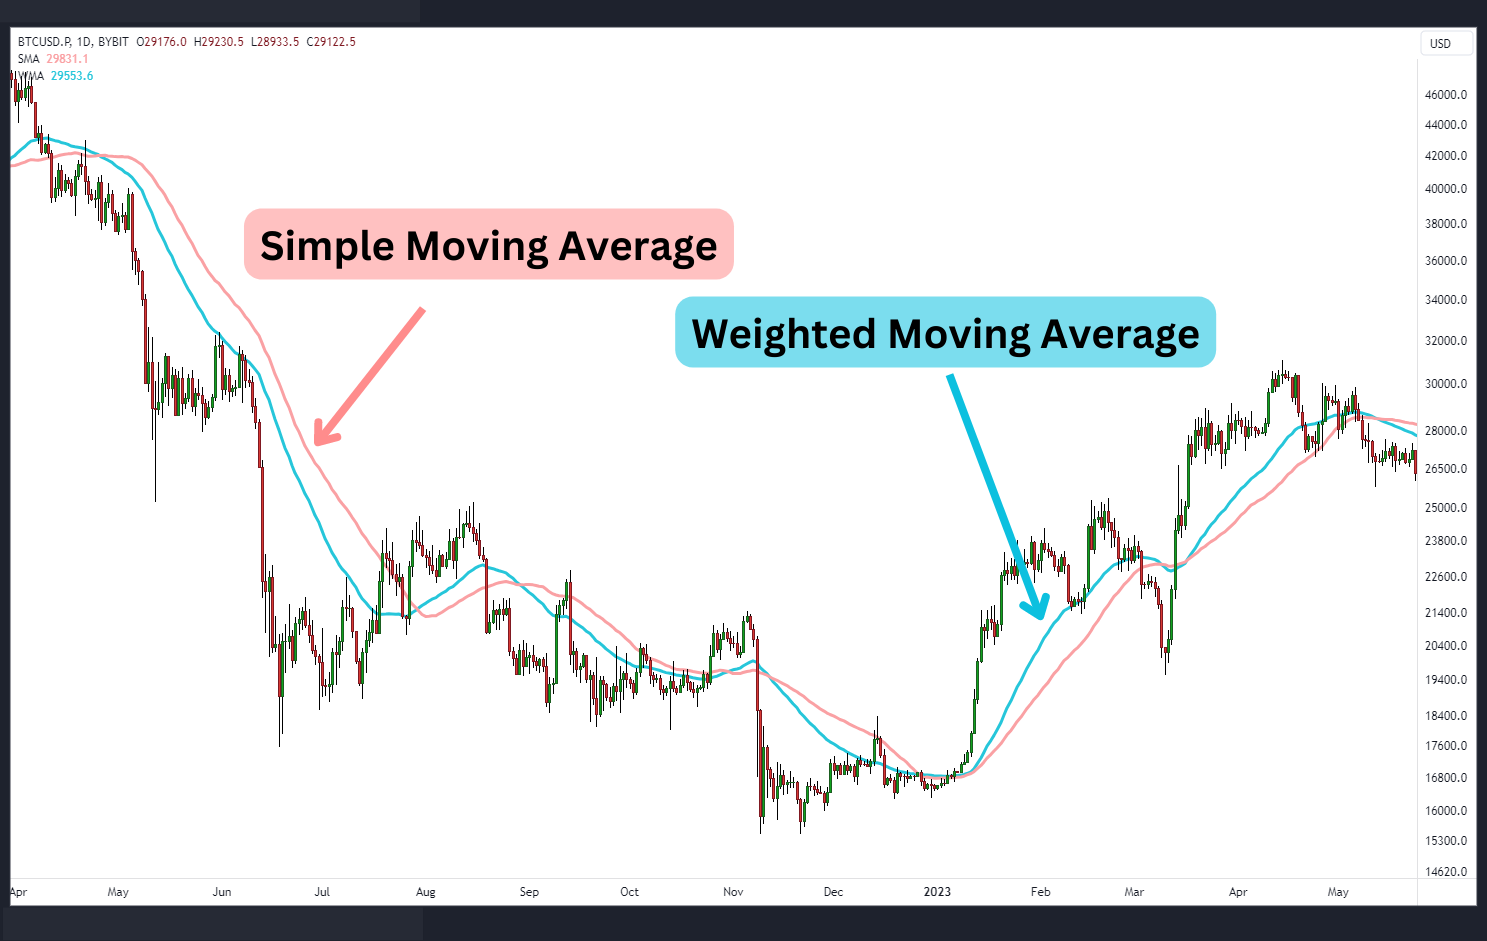
Weighted Moving Average (WMA)
A weighted moving average assigns varying weights to different data points within a selected time frame. This weighting scheme gives more importance to recent price movements, making it more responsive to short-term changes in market sentiment. Traders focusing on short-term trading strategies often favor WMAs for their ability to capture rapid price fluctuations and provide timely signals for potential trend reversals.
Since WMAs are calculated by multiplying each data point by a predetermined weight and summing up the weighted values, they offer a balance between smoothing out noise and reacting quickly to price movements.
Simple Moving Average (SMA)
On the other hand, a simple moving average calculates the average price movement over a specified number of periods, giving equal weight to all data points. SMA is known for its ease of calculation. It provides a smoother representation of price trends as compared to WMAs, as it considers a broader range of historical data.
An SMA is particularly useful for identifying long-term trends and providing a more stable view of the market. Traders who adopt longer time frames and investment horizons often find the simple moving average beneficial for trend-following strategies.
Key Differences
The most significant difference between WMA and SMA lies in their weighting schemes , since WMA assigns varying weights to data points while SMA treats all data points equally.
While a WMA is more sensitive to recent price movements, the simple moving average lags. Therefore, SMA offers a smoother representation of longer trends and is often preferred for longer-term analysis.
Weighted Moving Average (WMA) vs. Exponential Moving Average (EMA)
Weighted moving average and exponential moving average are similar technical indicators that essentially achieve similar objectives.
Both of these types of moving averages apply varying weights to each data set, making them more sensitive to recent price action. At a high level, traders who use one could also be interested in using the other. However, WMA and EMA assign weights to recent data points in slightly different manners.
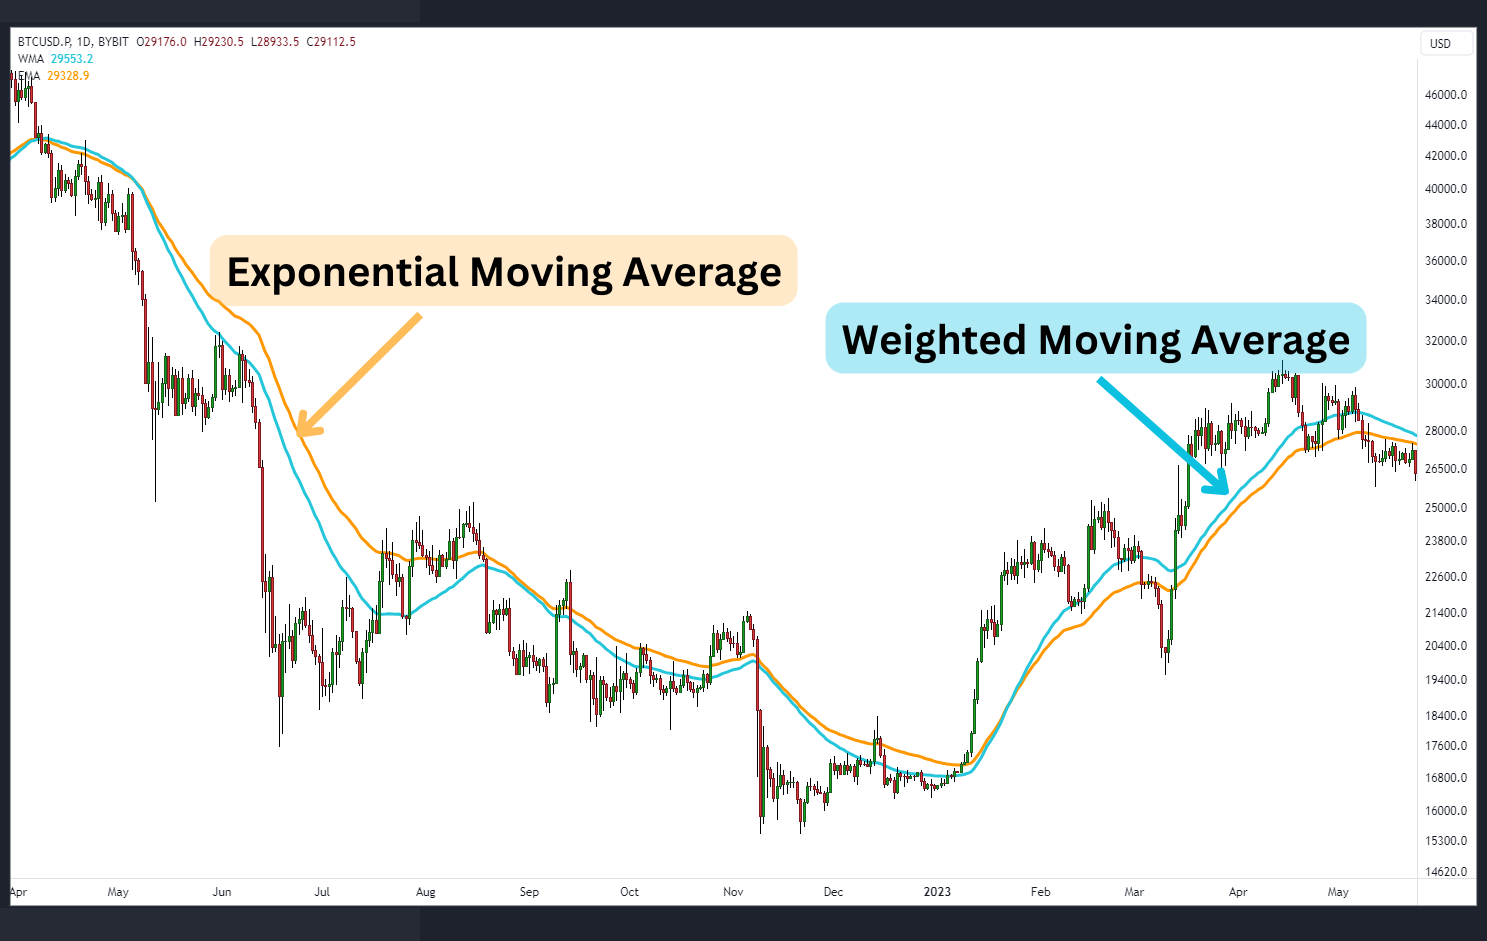
The most recent data is weighed more heavily on the WMA, due to its calculated multiplier. This means that in strong trends, the weighted moving average will hug closer to the pricing and reach further extremes relative to its exponential moving average and simple moving average cousins. If price reversal does appear, the EMA will have a little bit of a head start on the trend change, as the EMA lags behind the WMA on the trend change.
In conclusion, the choice between weighted moving average (WMA), simple moving average (SMA) and exponential moving average (EMA) depends upon a trader's preferred time frame, trading style and strategy. By understanding the strengths and weaknesses of the different indicators, a trader can effectively integrate them into their trading toolbox to enhance their decision-making process.
Conclusion
The weighted moving average (WMA) is a valuable technical indicator for determining trend direction and deciphering potential reversals in crypto. Its distinctive weighting scheme emphasizes recent price data, empowering traders to capture rapid shifts in market sentiment and make well-timed trading choices.
By integrating the WMA into their analytical toolkits and aligning it with other technical indicators, traders can navigate the dynamic cryptocurrency landscape with heightened precision and confidence, ultimately enhancing their trading outcomes.
#Bybit #TheCryptoArk