
Simple Moving Average (SMA): What It Is and How to Use It

A simple moving average is a commonly used technical analysis tool that calculates the average price of an instrument over a specified period. It is a "moving" average because it constantly updates with each new price bar, producing a line on a price chart. We’ll discuss what the simple moving average is, how to trade it and the advantages and disadvantages of using it.
Key Takeaways:
Simple moving average calculates the average price of an asset over a specified period, providing an average and fair value for it.
Moving averages are often used as a trend filter, or to determine levels of support for buying or resistance for selling.
The moving average is a lagging indicator, so traders often consider using it in conjunction with other indicators or analysis tools for confirmation.
What Is a Simple Moving Average?
Simple moving average (SMA), a tool used by traders in technical analysis, represents the average price of an instrument over a specified period of time. The average is called “moving” because it’s a single data point that recalculates with each new price bar, or candlestick. Therefore, it moves as new price data is discovered and traded, producing a line on a price chart.
Moving averages can be applied to any financial asset on any chart time frame. They can be used in buy-and-hold investment strategies, intermediate trend swing strategies and even to determine shorter-term trends used in day trading.
Traders use moving averages for several purposes. First, they help identify the overall trend of a market. For example, by observing whether a simple moving average line is sloping upward or downward (or moving sideways), traders can gain insights into the market's direction and potential opportunities.
Additionally, SMAs can be used to identify a price’s support or resistance levels. When a price tests a moving average from above, it’s often considered a bullish signal, indicating potential buying opportunities. Conversely, when a price rallies to test the bottom side of a moving average, it’s seen as a bearish signal, suggesting possible selling opportunities.
Moreover, some traders also use multiple moving averages to generate trading signals. This can be done by looking for crossovers between different moving average lines, such as the 50-day SMA crossing above or below the 200-day SMA. A bullish crossover known as the golden cross occurs when a short-term SMA crosses above the 200-day SMA. Similarly, when a short-term SMA crosses below the 200-day SMA, a bearish crossover called the death cross appears. These crosses are popular for indicating a potential change in trend direction, but these signals are not reliable (more on this below).
How to Calculate Simple Moving Average
Calculating the SMA is a relatively straightforward process that involves a few simple steps. Only one input variable is needed to calculate the moving average, namely, the length of the moving average you desire.
Common input values for the moving average length include 10, 20, 50, 100 and 200.
Simple Moving Average Formula
Let's calculate the 10-day SMA of a particular stock price. This calculation will use the closing prices for the past 10 trading days. Here are the closing prices, in chronological order:
Day 1: $50.00
Day 2: $52.25
Day 3: $51.50
Day 4: $49.75
Day 5: $48.90
Day 6: $51.10
Day 7: $52.40
Day 8: $54.20
Day 9: $55.80
Day 10: $56.50
To calculate simple moving averages, we sum up the closing prices for the time period (in this case, 10 days), and divide the sum by the number of periods.
In this example, the sum of the closing prices is 50.00 + 52.25 + 51.50 + 49.75 + 48.90 + 51.10 + 52.40 + 54.20 + 55.80 + 56.50 = 522.40. Dividing this sum by 10 (the number of periods) gives us the SMA:
SMA = $522.40 / 10 = $52.24
So, the 10-day SMA for this stock is $52.24. This value represents the average closing price over the time period of 10 days, and can help us identify the general trend and potential trading opportunities.
Since it’s a moving average, the oldest price (the first data point) is dropped, and the most recent closing price is included in the calculation as each new trading day occurs. For example, if the closing price for Day 11 is $57.80, then the moving average is recalculated by dropping the oldest point (Day 1 at $50.00) and including Day 11 ($57.80). The new moving average result is $53.02. This constant updating ensures that the SMA remains relevant and responsive to changes in the market.
By calculating simple moving averages for different periods (e.g., 20-day, 50-day or 200-day), traders can gain insights into long- and short-term trends, which can assist them in making informed trading decisions.
How to Trade Simple Moving Average
Traders often use moving averages in conjunction with other technical trading tools. There are three basic strategies when using the simple moving average:
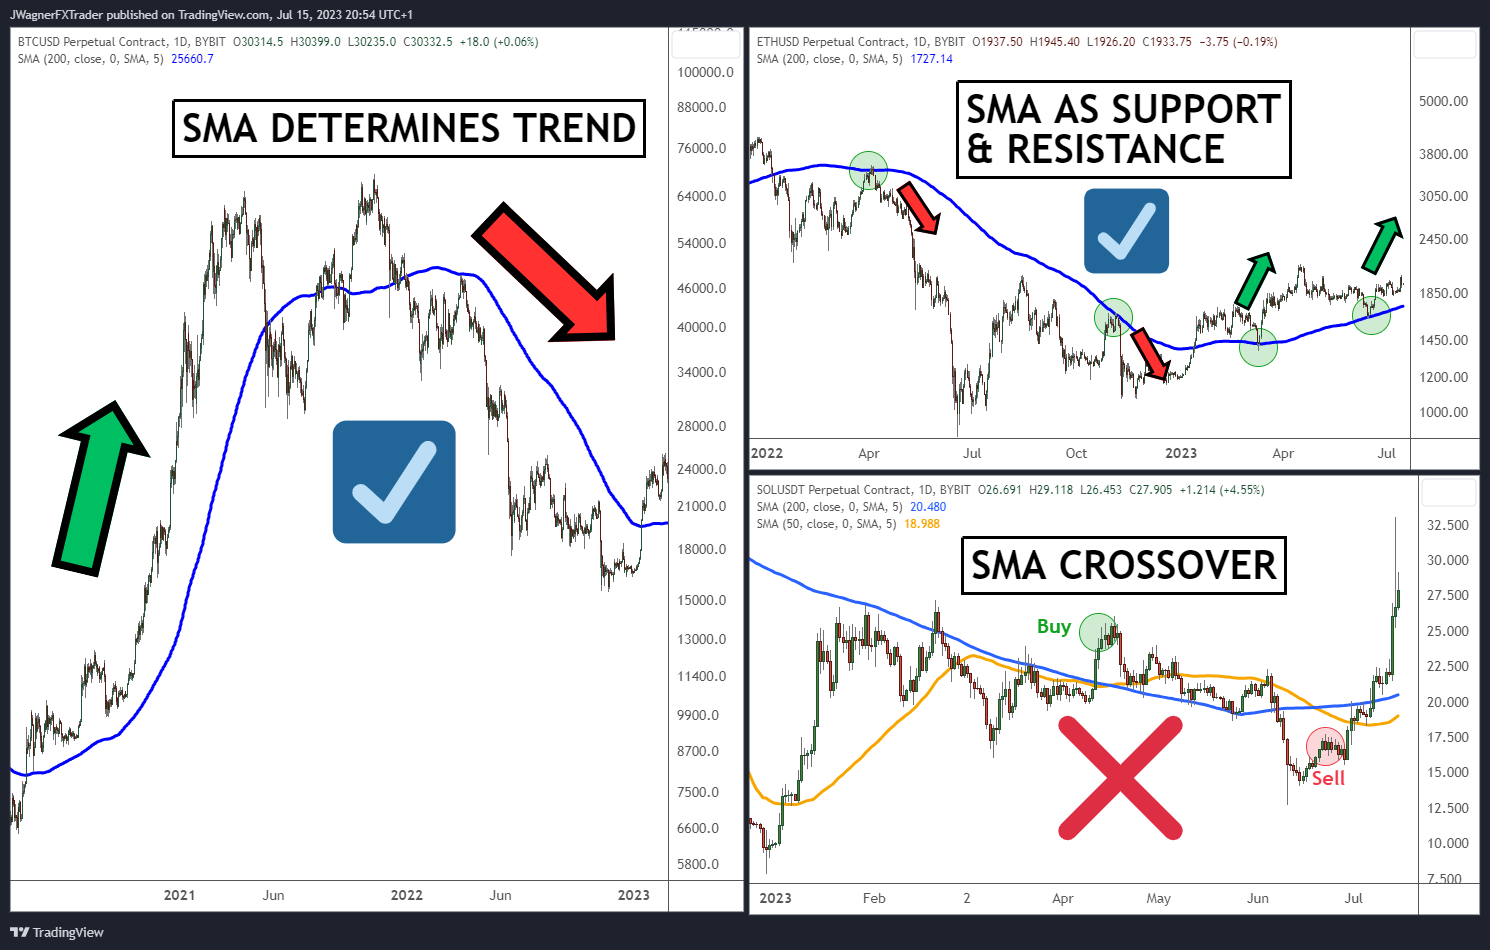
Determine price trends
Support and resistance to determine short-term trend reversals
Moving average crossover
Using the moving average to determine the current trend is one of the most popular uses. Strategies that are trend-following or include multi–time frame analysis likely have a moving average to signal the trend direction.
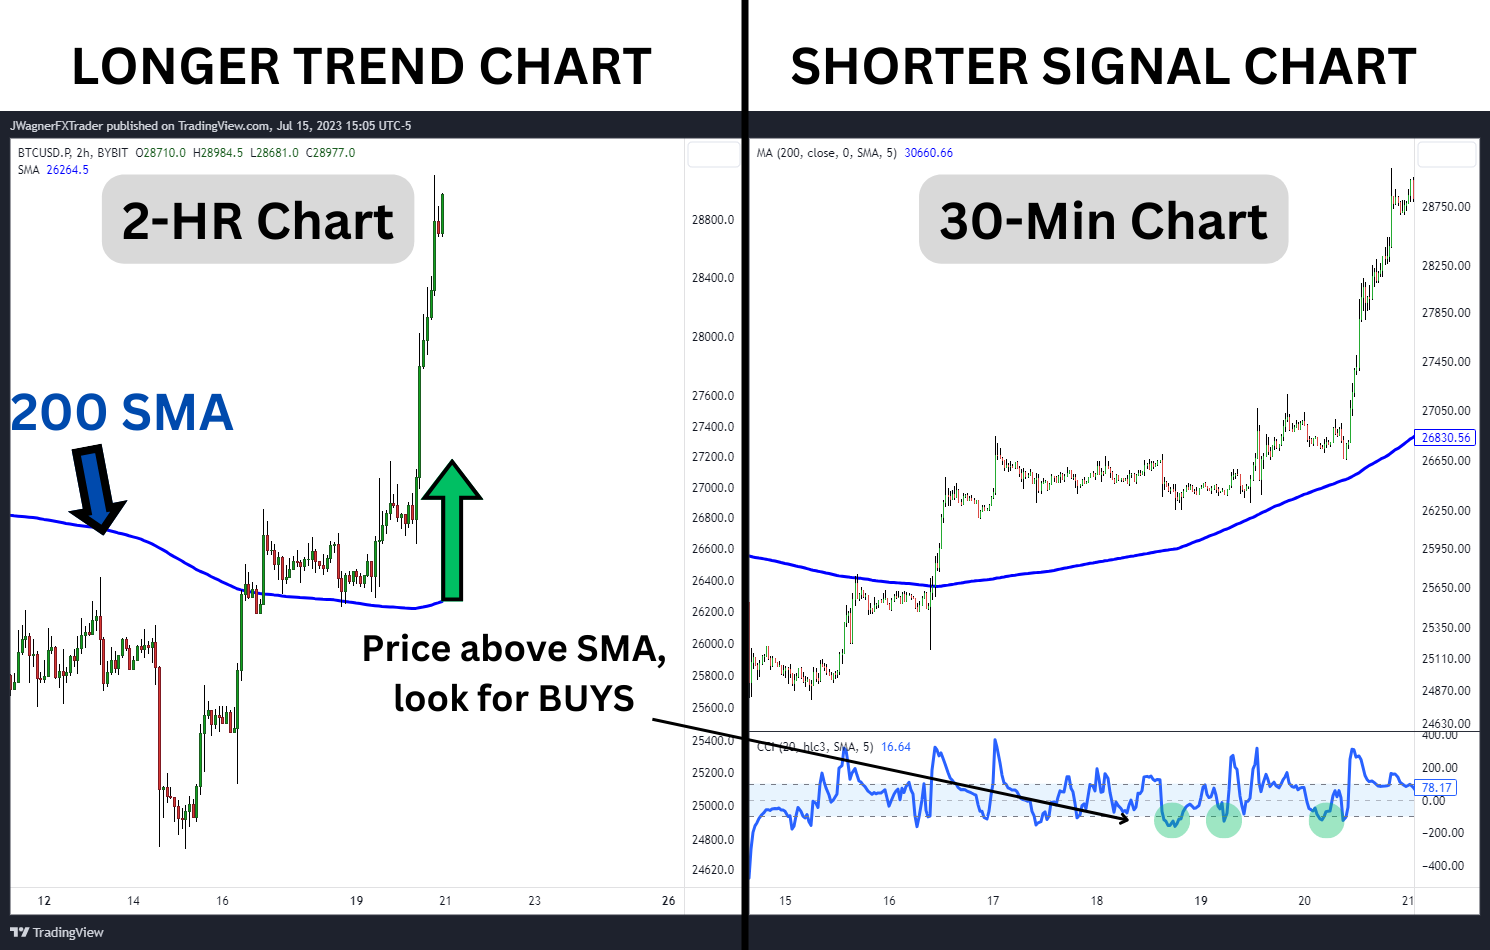
For example, in multi–time frame analysis, the larger chart time frame will use a 200-period SMA to determine the trend. In this example, a day trader might use a 200-period SMA on the two-hour price chart to determine the larger trend.
The next step is to filter trades so that you only look for long positions if the price is above the 200 SMA, or only trade shorts if the price is below the 200 SMA.
On a 30-minute price chart, use the commodity channel index (CCI) to generate a signal in the direction of the trend. The addition of CCI will help you synchronize your trades with the trend direction, and potentially increase the accuracy of your trading decisions.
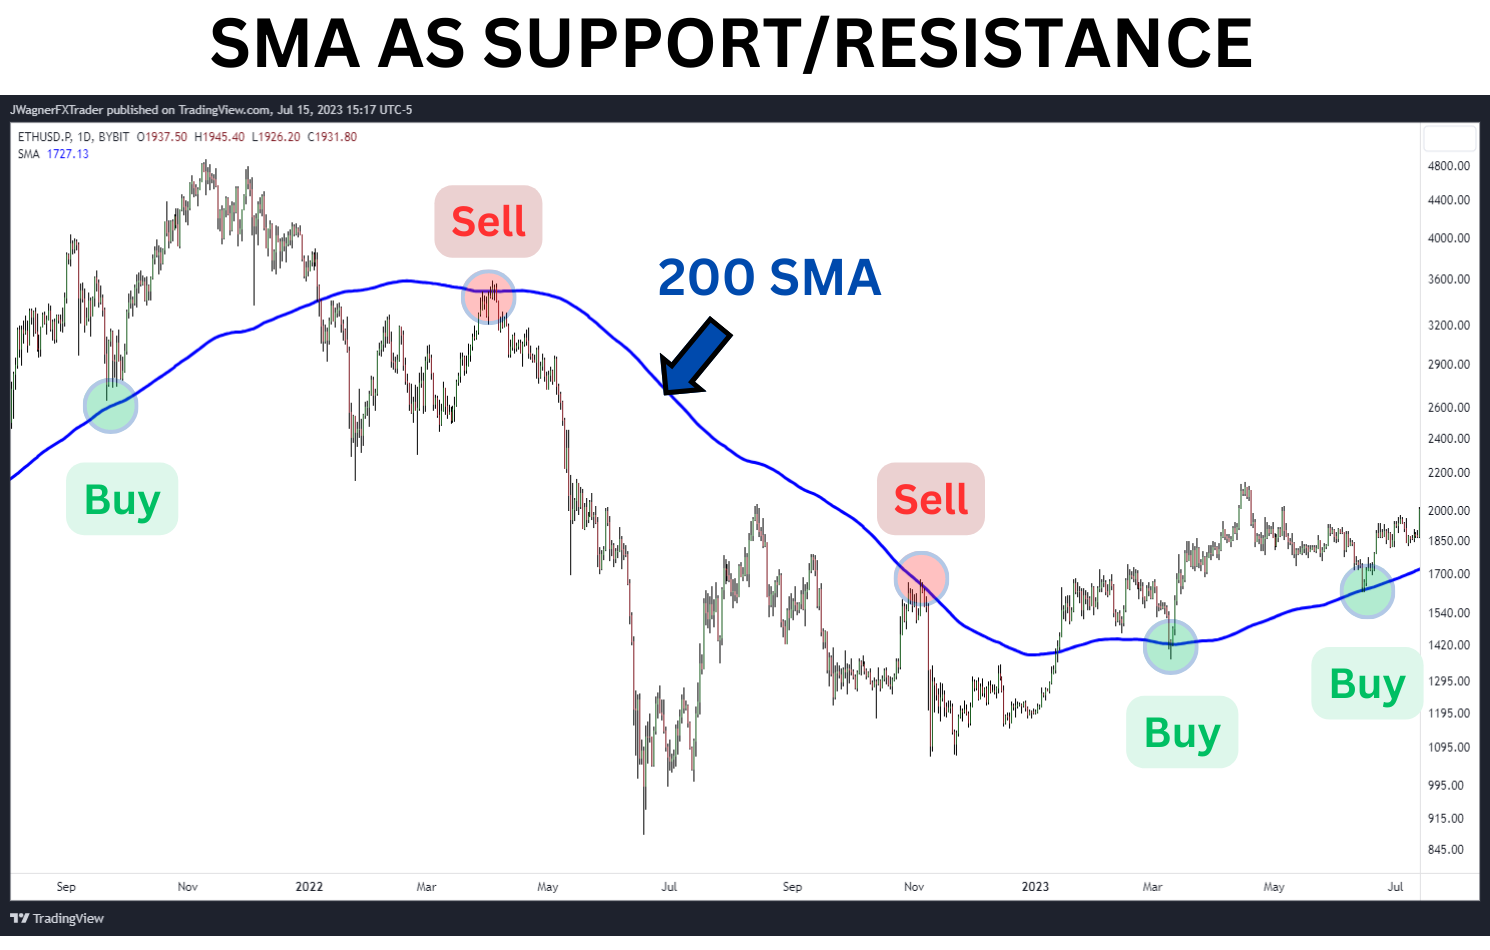
Moving averages can also be used as support and resistance levels. This is especially useful for the 50-day and 200-day SMA on daily price charts.
Large institutions follow these moving averages, so when the price reverts to the average, the big-money players view it as a true average (or "fair") price. They’ll use the moving average as “support and buy,” creating a bounce in price. Or, they’ll use the moving average as “resistance and sell,” causing a dip in price.
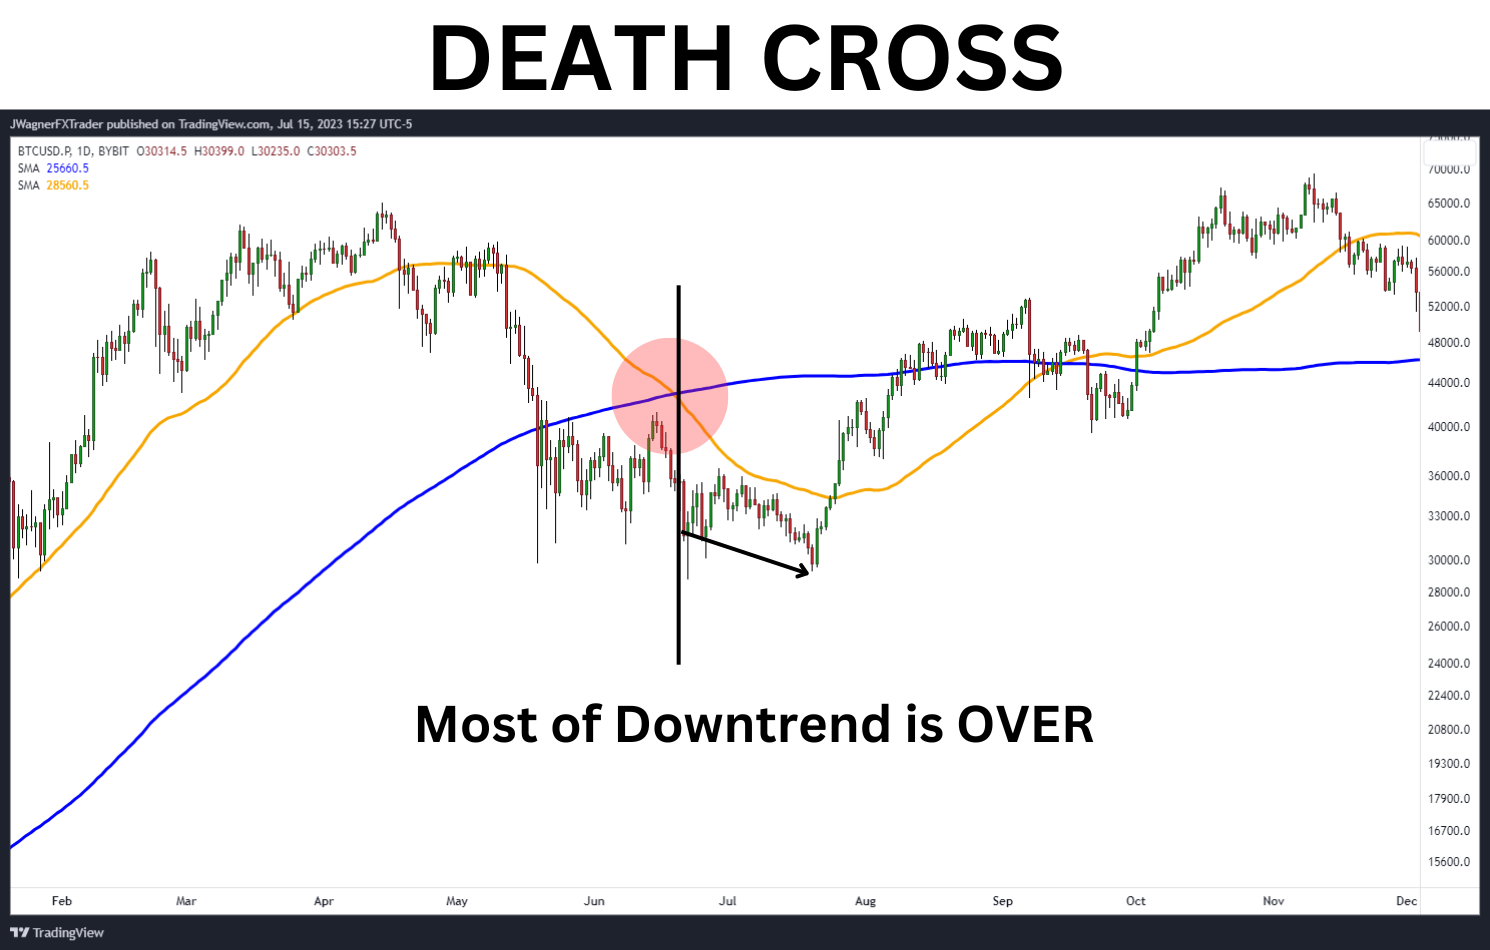
The moving average crossover strategy incorporates two or more moving averages onto the same chart. When they cross, a trading signal is generated. Although this strategy is widely touted, it’s essential to exercise caution. Unlike the other strategies mentioned, this one isn’t as reliable, and it’s crucial to scrutinize it so that you’ll be aware of its possible risks.
For example, in the above chart, when the 50-day moving average crosses below the 200-day moving average, this is called the death cross. The death cross is a bearish signal, suggesting the market is in a bear trend. However, as you can see above, the price has already declined significantly, making the death cross signal a very late alert to the changing market conditions.
The opposite is true when the short-period SMA crosses above the long-term trend. This is called a golden cross, widely considered to be indicating a bullish market.
Pros and Cons of the Simple Moving Average
The simple moving average is arguably one of the most popular technical analysis tools used by traders and institutions. It offers several benefits, but there are drawbacks too. Let's explore these advantages and disadvantages.
Pros
Smooths Out Price Noise:Moving averages smooth prices on charts, making it easier for traders to identify the underlying trend by filtering out short-term price fluctuations and noise. This helps traders focus on the broader market direction, and reduces the impact of temporary market anomalies.
Easy to Understand: The calculation of the SMA is relatively simple, involving the average closing prices over a specific period. This simplicity makes it accessible to traders of all experience levels, including beginners in technical analysis.
Widely Used and Recognized: The SMA is a popular indicator among traders. Therefore, a significant number of market participants keep an eye on the SMA, increasing its potential relevance and effectiveness as a support/resistance level.
Cons
Lagging Indicator:One of the main limitations of the SMA is that it’s a lagging indicator. Since it relies on historical price data, it reacts slowly to recent price changes. As a result, it may not provide timely signals for entering or exiting trades during periods of rapid market movements.
Equal Weighting of Prices: SMA treats all prices within a selected period equally, regardless of their proximity to the current price. This equal weighting may not accurately reflect current market sentiment, since older prices have the same influence as more recent ones.
May Generate False Signals: Like any technical indicator, the SMA isn’t foolproof and can thus generate false signals. Traders need to be aware that the SMA can produce buy or sell signals that may not always align with actual market movements. This is why many traders consider using the SMA in conjunction with other indicators or analysis tools for confirmation.
Simple Moving Average vs. Exponential Moving Average
In addition to the simple moving average (SMA), another commonly used technical analysis tool is the exponential moving average (EMA). While both indicators serve similar purposes, identifying trends and generating trading signals, there are significant differences between the two. Understanding these distinctions can help traders determine when to use one over the other. Let's explore the key differences and their practical implications.
Calculation Method
The major difference between simple and exponential moving average lies in their calculation methods. The simple moving average (SMA) takes the average prices over a specified period, while the exponential moving average gives more weight to recent prices, making it more responsive to recent market activity. The exponential moving average (EMA) calculation assigns exponentially decreasing weights to older prices, with the most recent prices receiving the highest weight.
Responsiveness to Price Changes
EMA reacts more quickly to recent price action, compared to SMA. Since EMA assigns greater importance to recent prices, it adapts faster to shifts in asset prices and sentiment. This responsiveness makes EMA a preferred choice for traders seeking to capture short-term price movements or take advantage of rapidly changing market conditions.
Smoothing Effect
While EMA is more sensitive to recent price action, SMA provides a smoother line on price charts. The SMA's calculation requires equal weight of all prices within the time period, resulting in a less volatile line. This smoothing effect of the SMA can be beneficial for traders focusing on longer-term trends and filtering out short-term noise or fluctuations.
Tradeoff Between Responsiveness and Smoothness
Choosing between the SMA and EMA depends on the trader's time horizon and trading strategy. Traders with a shorter time frame, or those aiming to capitalize on intraday or short-term price movements, may prefer EMAs due to their responsiveness. On the other hand, traders with a longer time horizon or those who prioritize a smoother trend analysis may lean toward the SMA.
Both the simple and exponential moving averages are typically used to confirm trends. When the price movements are above the moving average, it suggests a potential uptrend, while the price movement below indicates a likely downtrend. However, due to the EMA's responsiveness, it may provide earlier signals of trend reversals as compared to the SMA.
As a result, the choice between the SMA and EMA once again depends on the trader's preferences, time horizon and trading strategy. EMA offers quicker responsiveness to recent price movement and is suitable for short-term trading, while SMA provides a smoother trend analysis and is often favored for longer-term trading.
Conclusion
A simple moving average (SMA) provides a smooth trend analysis and is popular among traders. By understanding their benefits and disadvantages, traders can effectively incorporate moving averages into their technical analysis and trading decisions.
#Bybit #TheCryptoArk