
Keltner Channel: What It Is and How to Use It

A Keltner Channel is a versatile tool that assists retail cryptocurrency traders in identifying trends, potential reversals and market volatility. It combines moving averages and average true range to provide insights into market conditions.
Key Takeaways:
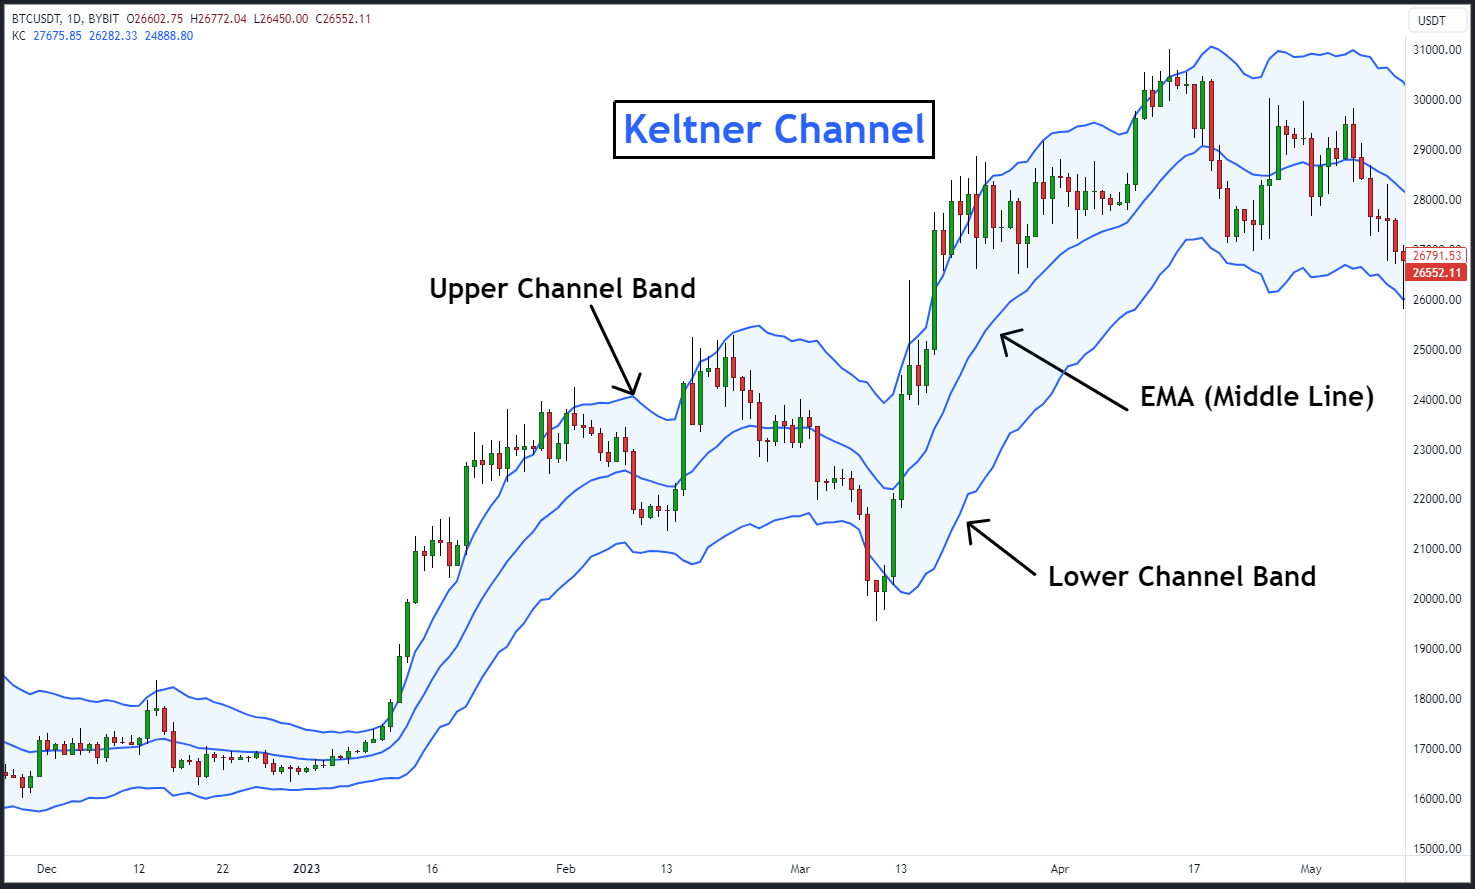
The Keltner Channel consists of three lines: a midline (typically an exponential moving average), an upper line and a lower line.
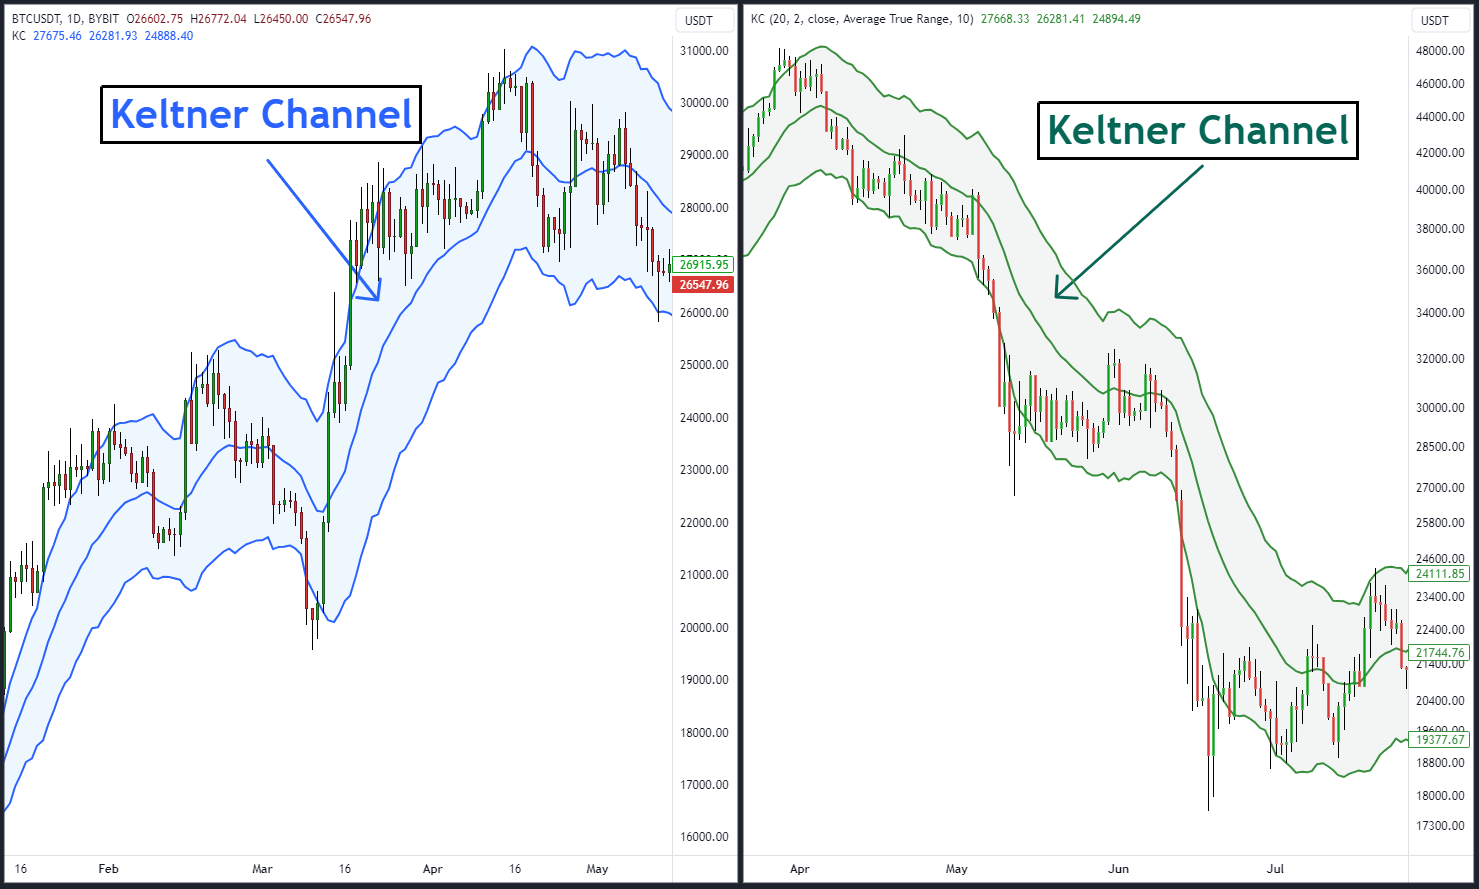
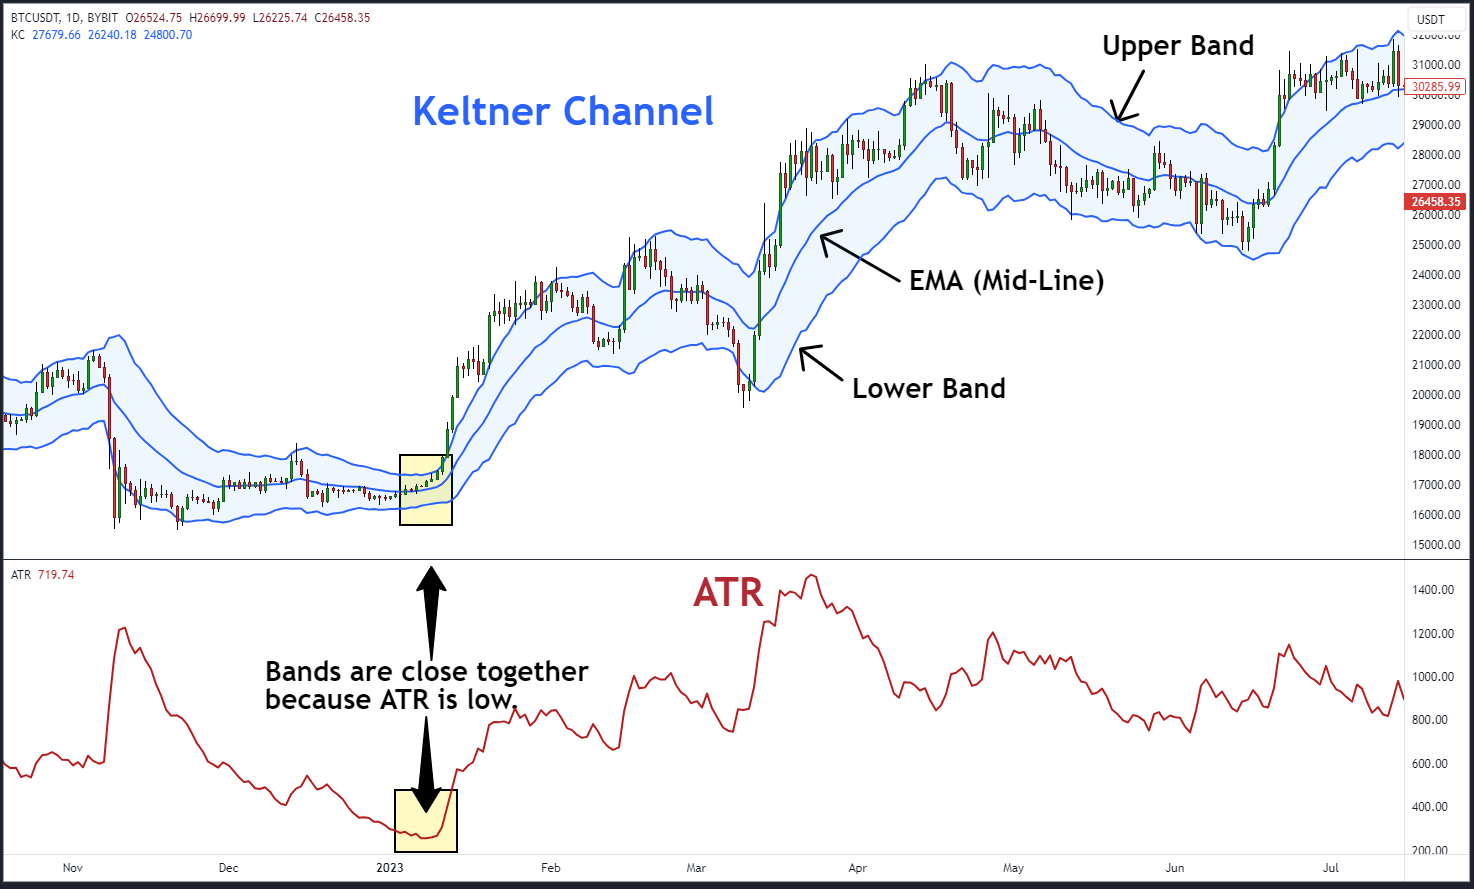
Keltner Channels offer insights into price volatility. Widening channels suggest increased volatility, while narrowing ones indicate decreased volatility.
Keltner Channels are used for pullbacks and channel breakouts, offering traders opportunities to enter and exit positions based on price movements relative to the channels.
What Is a Keltner Channel?
A Keltner Channel is a powerful technical analysis tool retail traders use to spot volatility, identify trends and potential trend reversals, and make informed trading decisions in the cryptocurrency market. It’s a versatile indicator that combines elements of both a moving average and an envelope indicator.
Developed by Chicago grain trader Chester W. Keltner in the 1960s, the Keltner Channel consists of three lines that expand and contract, depending upon the volatility of the market. The fundamental calculation includes an exponential moving average (EMA) combined with average true range (ATR). Traders review the position of current price action relative to the Keltner Channels, while also considering the slope of the indicator’s channel lines, in order to determine trends and potential reversals in the market.
Interpreting Keltner Channels
The Keltner Channel indicator is fairly straightforward, but it also contains a lot of information.
Following is a breakdown of its components.
Middle Line (EMA or SMA):The core of the Keltner Channel is the middle line, which is typically an EMA. This line represents the trend direction and acts as the baseline for the channel. Traders use different periods for the EMA, depending upon their trading style and time frames. Though the default setting for the middle line is a 20-period EMA, the middle line can also be a simple moving average (SMA).
Upper Channel Line:The upper band line is plotted above the middle line and is derived by adding a multiple of the ATR to the middle line. The ATR measures market volatility, and traders can adjust the multiplier to suit their risk tolerance. A higher multiplier results in wider channels, accommodating higher volatility. Traders typically use a multiplier of 2 and an ATR setting of 10.
Lower Channel Line: Conversely, the lower band line is plotted below the middle line by subtracting a multiple of the ATR from it. This line represents an extreme dip below the average within an upward trend, or potential deviation from the mean within a downtrend. Again, the default setting is a multiplier of 2 with an ATR setting of 10.
The Keltner Channel provides a visual representation of price volatility, with widening channels indicating increased volatility and narrowing channels suggesting decreased volatility. As volatility collapses, ranges typically form. If volatility expands, trends are likely to develop.
Trading strategies are then created around the market conditions. Range trading strategies are deployed when market volatility drops, and momentum and breakout strategies are used when volatility expands.
How to Calculate the Keltner Channel
Calculating the Keltner Channel involves a few straightforward steps, primarily based on the ATR and a chosen moving average. Most charting packages include Keltner Channels, so you don’t have to calculate them by hand.
However, it’s advisable to understand how the channels work so you can find the best settings for your strategy. Below is a step-by-step guide to calculating Keltner Channels.
Keltner Channel Calculation
Keltner Channel Middle Line = EMA
Keltner Channel Upper Band = EMA + (2 * ATR)
Keltner Channel Lower Band = EMA − (2 * ATR)
EMA = Exponential moving average for 20 periods
ATR = Average true range for 10 periods
Select a Period for the Moving Average: The first step is to decide whether you want to use an EMA or an SMA as the centerline for your Keltner Channel. Traders often use a 20-period EMA or SMA, but you can adjust this according to your trading strategy and time frame.
Calculate the Average True Range: The ATR is a measure of market volatility and is typically calculated over 10 periods for Keltner Channels.
Determine the Multiplier: The multiplier is a constant value used to adjust the width of the Keltner Channel. A common choice is 2, but you can customize it based on your preferences and the level of volatility in the cryptocurrency you're trading.
Calculate the Upper and Lower Bands: To calculate the upper channel line, add the moving average value to the ATR value multiplied by the chosen multiplier. Similarly, for the lower channel line, subtract the ATR value multiplied by the multiplier from the moving average.
Now that you’ve calculated the Keltner Channel's upper and lower lines, you can plot them on your price chart. These lines will dynamically adjust, based on market conditions, reflecting changes in volatility (i.e., ATR). This dynamic quality makes the Keltner Channel a valuable tool for traders, allowing them to adapt to shifting market environments.
The Best Settings for Keltner Channels
The best Keltner Channel settings can vary, depending upon your trading goals, the cryptocurrency you're trading and your preferred chart time frame.
The default Keltner Channel settings are a 20-period EMA with a 10-period ATR using a 2x multiplier. Any of these settings can be changed according to your strategy. However, here are some general guidelines to help you choose the best settings.
Moving Average Time Frame: Consider the time frame of your trading. Short-term day traders may prefer lower periods for the moving average, such as a 10-period EMA, while longer-term traders might use a 50-period EMA. Experiment with different time frames to see which one aligns best with your trading strategy.
Multiplier: The multiplier you choose can be adjusted, as it determines the channel's width and sensitivity to price movements. A multiplier of 2 is a common starting point, but you can tailor it to be higher or lower to match the volatility of the cryptocurrency you're trading. Higher multipliers widen the channel, while lower ones narrow it. Day traders would generally consider a lower multiplier such as 1.5, due to the shorter chart time frame they use.
Average True Range Time Frame: Another way to adjust the width of the upper and lower bands is through the number of periods used on the ATR. A shorter lookback period, such as 7, will result in more volatile bands. A longer lookback period will yield smoother bands. If a day trader wants to smooth out the bands, they may consider a longer lookback period such as 20.
Remember that there’s no one-size-fits-all approach when it comes to the best Keltner Channel parameters. Traders should customize their settings to suit market conditions and their individual preferences, continually refining their strategy based on experience and analysis.
Keltner Channel Strategies
The Keltner Channel is mostly used as a trending and momentum indicator. There are a couple of different strategies, depending upon your style of trading.
Pullback Strategy
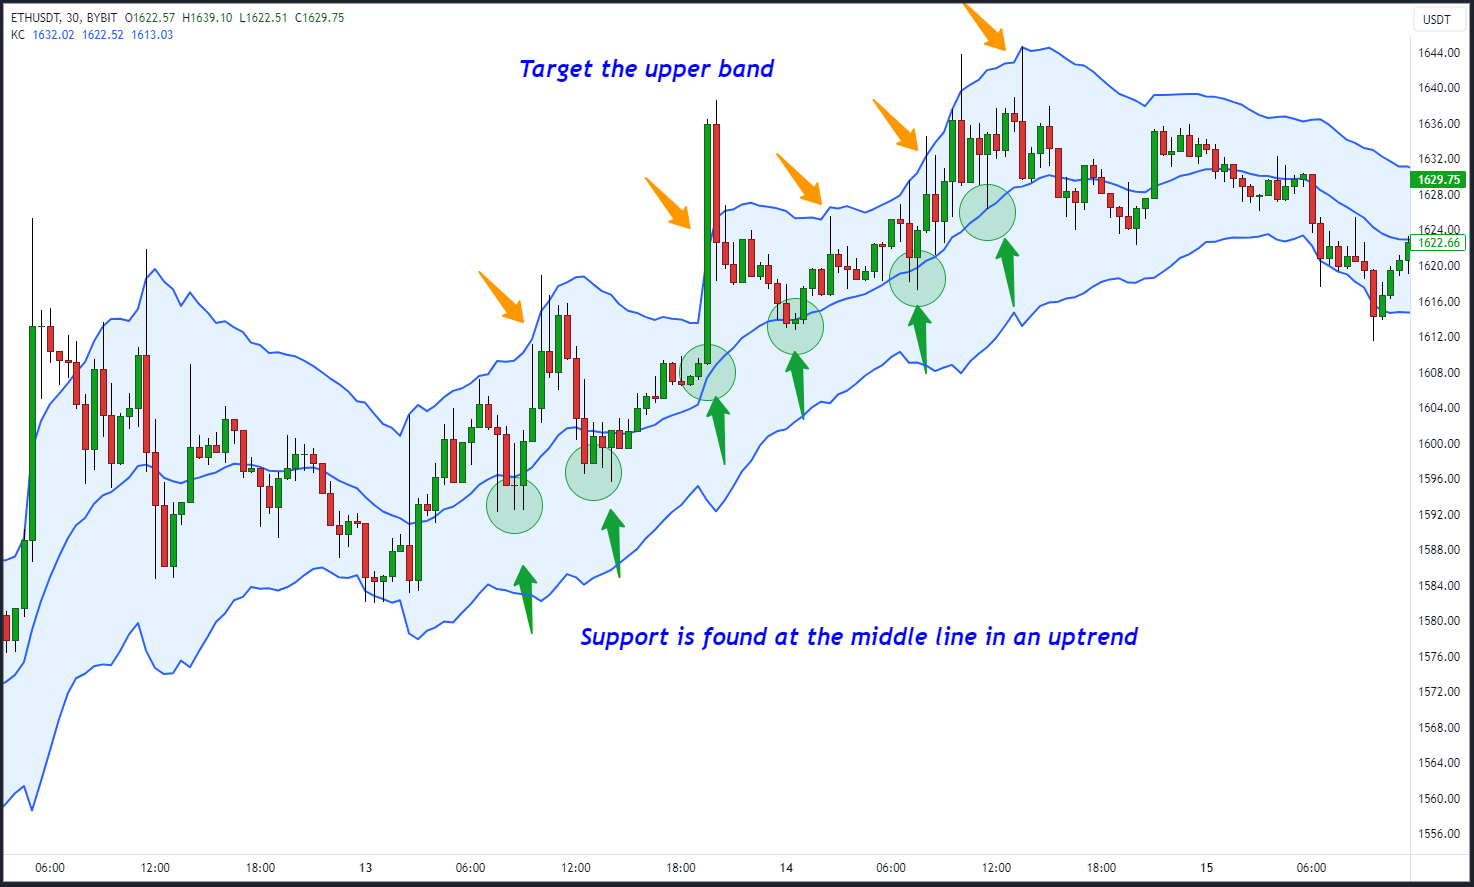
When the market is trending higher, prices will mostly remain in the upper portion of the Keltner Channel. The moving average can be seen as a support zone, such that when prices fall, the moving average may be a place of value where buyers choose to buy.
To implement this strategy, you'll first wait for prices to reach the middle line. If the price temporarily falls below the middle line, wait for it to regain the middle line to enter. Then, place a stop loss about halfway between the moving average and the lower channel line. Aim for the upper band for a risk-to-reward ratio of around 1:2.
The opposite would be true in a downtrend, except for prices holding in the lower zone of the Keltner Channel. In such cases, a rebound back to the moving average presents an opportunity for short sellers to enter. The stop loss should be positioned about halfway between the moving average and the upper band, with the target located at the lower band.
Breakout Strategy
There are times when the market moves quickly and breaks out. In those circumstances, the Keltner Channel breakout can be used to ride a quick move.
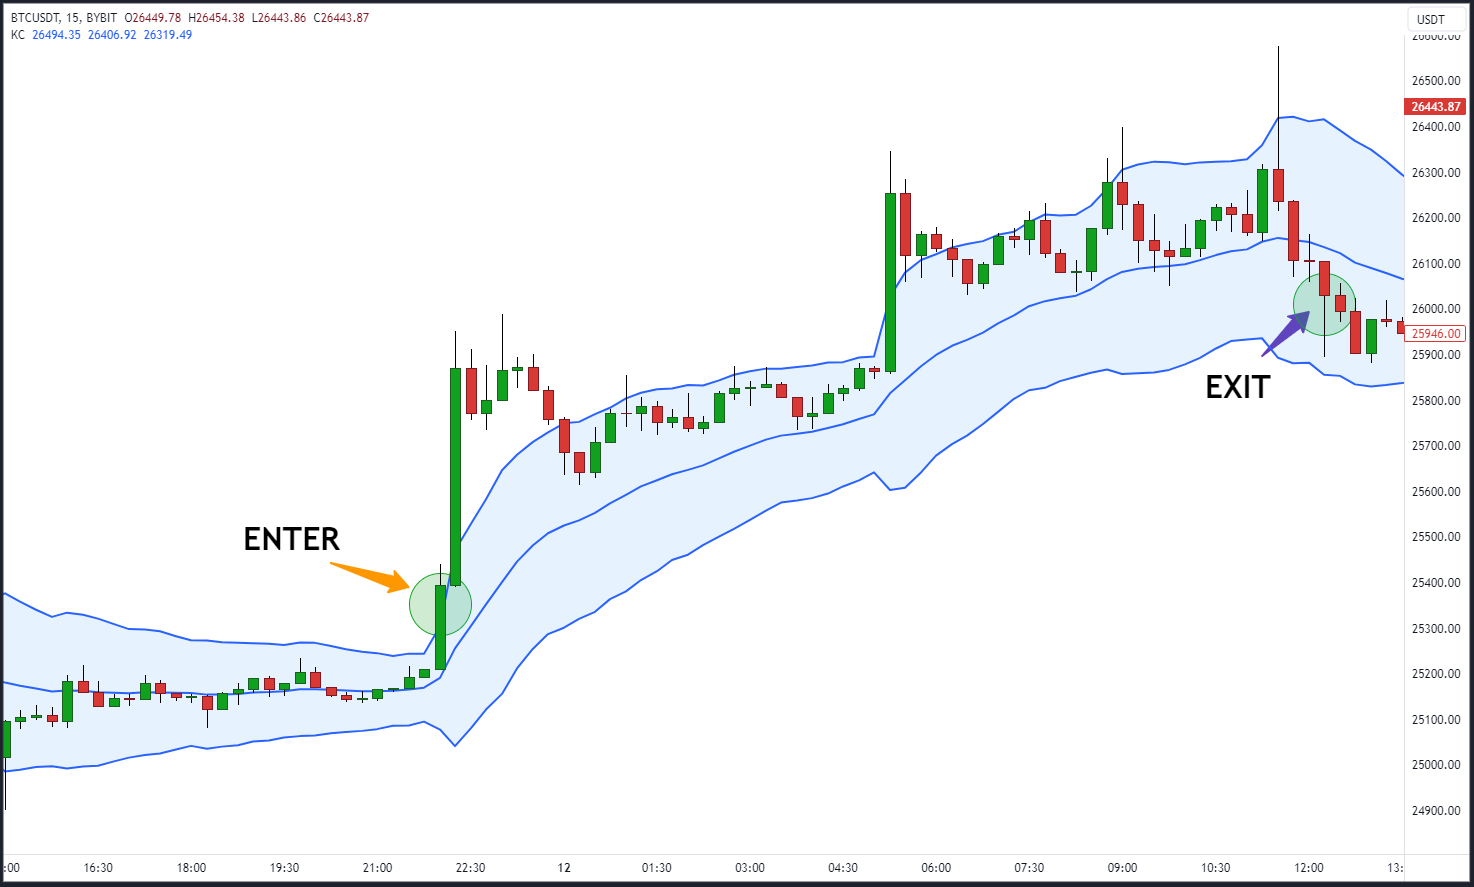
Once your indicator is set up on the chart, wait for the price to close above the upper band or below the lower band.
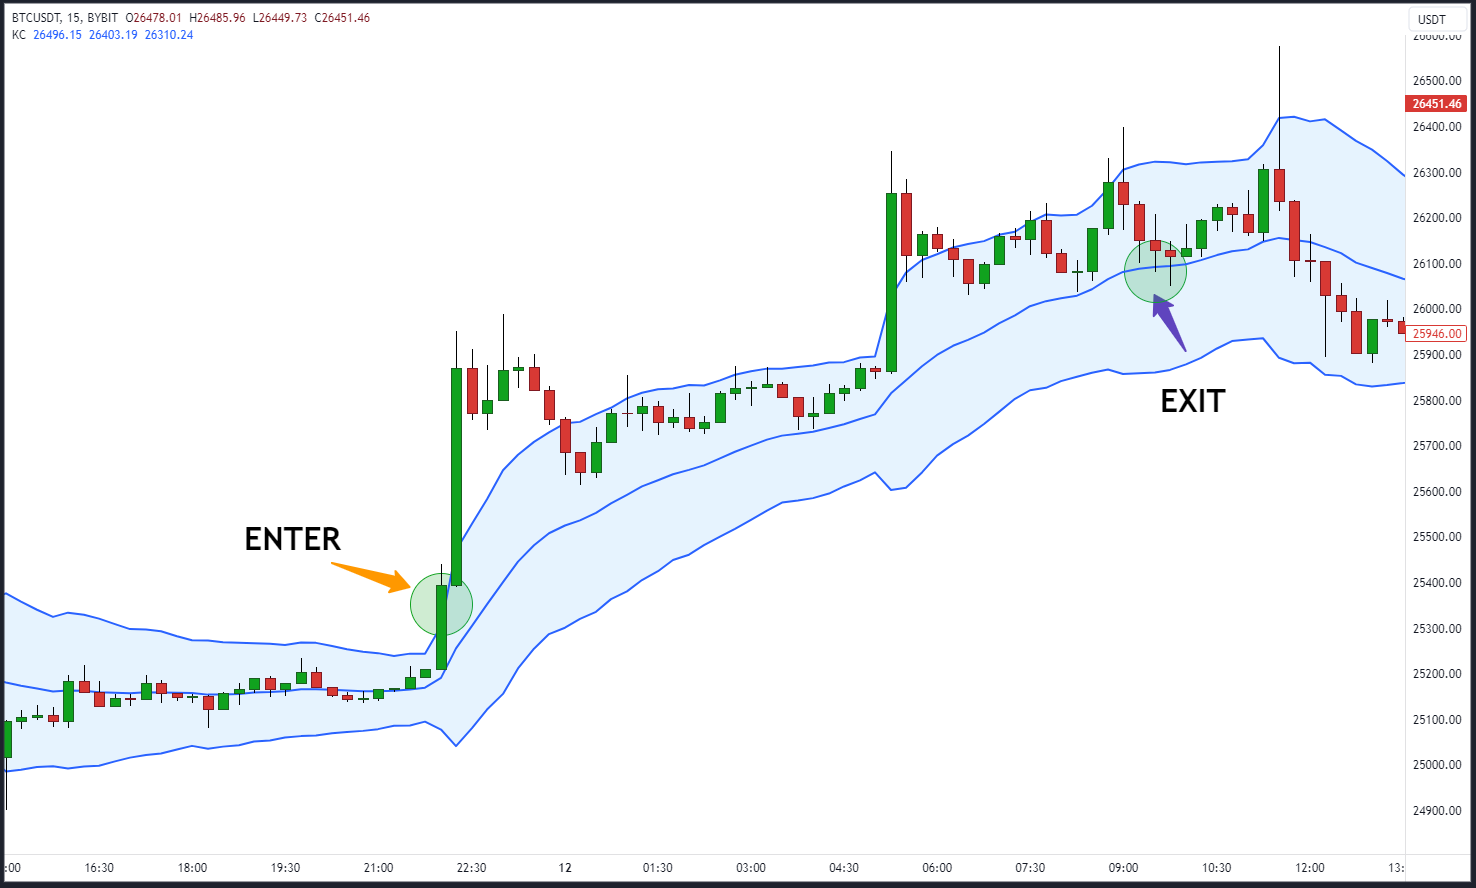
In the example above, Bitcoin rallies to create a closing candle above the upper band on the 15-minute chart. A trader would take that as a buy signal. The exit strategy involves implementing a dynamic trailing stop, based on the middle line (the EMA). Once the price touches or crosses the middle line, the trader would close the trade.
Within strong uptrends, prices tend to stay in the upper portion of the Keltner Channel. This enables buyers to potentially lock in a profitable trade as the moving average has a chance to catch up with rising prices, allowing traders to exit their positions while prices remain favorable.
Combining Pullback and Breakout
You'll notice that the pullback strategy enters a long position at the midline, while for the breakout strategy, the exit also occurs at this juncture.
It’s up to you if you want to combine both strategies, entering a long position on a breakout, but instead of exiting at the middle line, place the stop loss halfway between the midline and the lower band.
This decision hinges on whether you want more leeway on the dynamic stop loss in order to stay in the position for a longer duration. However, it may occasionally mean exiting the position at a less favorable price.
Keltner Channels vs. Bollinger Bands
When it comes to technical analysis, traders often encounter the question of whether to use Keltner Channels or Bollinger Bands. Both are popular, volatility-based indicators that help traders identify potential entry and exit points, but they have distinct differences in terms of calculation and interpretation.
Keltner Channels vs. Bollinger Bands: Key Differences
Calculation Method
Keltner Channels: Keltner Channels use an ATR to measure volatility and create dynamic channel boundaries. The upper and lower lines of the Keltner Channel are determined by adding or subtracting the ATR from a moving average, respectively.
Bollinger Bands: Bollinger Bands use standard deviation to measure price volatility. The bands consist of three lines: the middle line is a simple moving average, and the upper and lower bands are calculated by adding and subtracting a multiple of the standard deviation from the middle line.
Volatility Representation
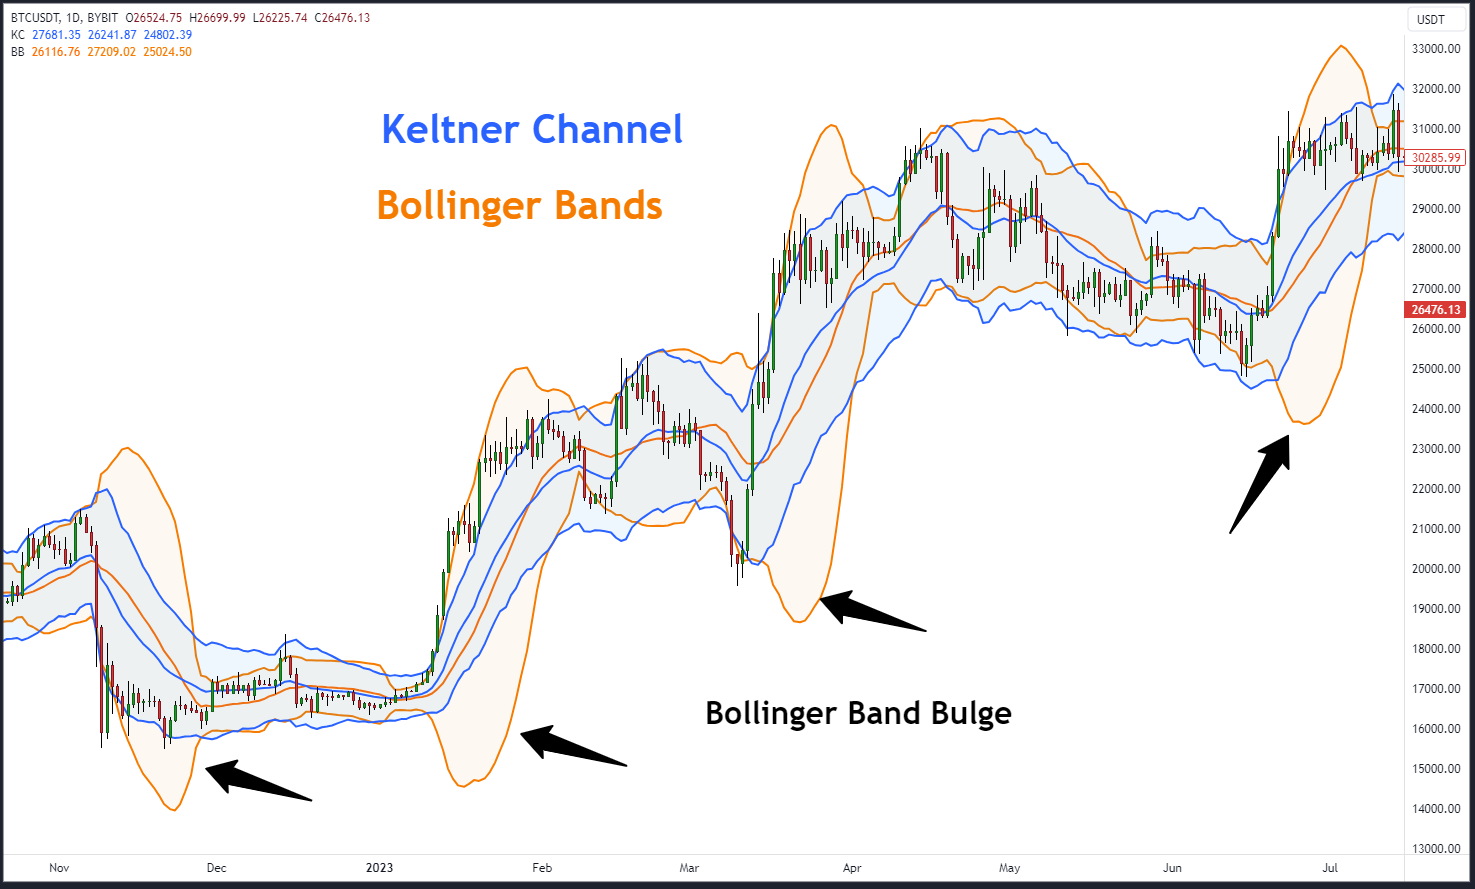
Keltner Channels: Keltner Channels provide a smoother representation of volatility, resulting in less responsive channel lines. They may be better suited for traders looking for clearer trend signals.
Bollinger Bands: Bollinger Bands are more responsive to rapid price changes, due to their use of standard deviation. This makes them sensitive to short-term price spikes, and can lead to extremely wide bands. [See the Bollinger Band bulges in the image above.]
Signal Interpretation
Keltner Channels: Keltner Channels are often used to identify trend direction and potential breakouts when the price crosses the channel boundaries. Traders may rely on Keltner Channels for trend confirmation.
Bollinger Bands: Bollinger Bands are commonly used to identify overbought and oversold conditions. When the price touches or crosses the upper band, it may indicate overbought conditions, while touching or crossing the lower band may suggest oversold conditions.
Which Is Better: Keltner Channels or Bollinger Bands?
The choice between Keltner Channels and Bollinger Bands ultimately depends upon your trading style and objectives. There is no uniformly best answer, as both indicators offer unique insights into market volatility.
Keltner Channels are preferable for traders who value smoother trend signals and want to focus on trend confirmation. The indicator may be instrumental in trending markets, where clear breakout signals are sought.
Bollinger Bands are more difficult to use for spotting good signals, as their volatility measure can skew the bands significantly. Therefore, Bollinger Bands are better suited for range-bound markets, and can help identify price extremes.
If you're looking for trends and momentum breakouts, then Keltner Channels will be more useful. In range-bound markets, Bollinger Bands can help spot overbought and oversold levels.
Keltner Channel Limitations
While Keltner Channels are a valuable technical analysis tool, they come with their own set of limitations that traders should be aware of.
Like any trend-following indicator, the Keltner Channel can produce false signals during periods of low volatility. Traders may experience whipsaws in which the price briefly crosses the channel boundaries before reversing, leading to potential losses.
Keltner Channels are also considered a lagging indicator because they rely on historical price data. This means they may not provide timely signals during fast-moving market conditions or sudden price changes.
The Keltner Channel strategy may not work equally well for all cryptocurrencies or financial instruments. Some assets exhibit unique price behavior, such as extreme volatility, that may not align with the indicator's characteristics.
Additionally, finding the best Keltner Channel settings can be challenging. The ideal moving average period and multiplier may differ for each trader and market, requiring continuous adjustments and backtesting.
Lastly, relying solely upon Keltner Channels for trading decisions can be risky. Traders often consider incorporating other indicators and chart patterns to confirm signals and reduce the risk of false positives.
Traders need to understand these limitations when incorporating Keltner Channels into their trading strategies. The Keltner Channel is not a foolproof indicator, and its use is just one part of a broader tool kit in technical analysis.
Conclusion
While Keltner Channels are a valuable tool for cryptocurrency traders, it's essential to understand their limitations. They may generate false signals in low-volatility markets, lag during fast-moving conditions and require constant customization. To maximize their effectiveness, traders should consider combining Keltner Channels with other indicators and strategies.
#Bybit #TheCryptoArk