
Directional Movement Index: How to Use the DMI Indicator

The directional movement index (DMI) is a widely used technical indicator in financial markets for assessing trend direction and strength. Developed by J. Welles Wilder Jr., it consists of three indicators: the positive directional indicator (+DI), the negative directional indicator (−DI) and the average directional index (ADX).
In this article, we’ll look at what the DMI is, what it tells you, and how to use it for trending and range-bound markets.
Key Takeaways:
The DMI helps identify trends and their strength, enabling traders to align their strategies with prevailing market conditions.
+DI and −DI crossovers can serve as entry and exit signals, providing opportunities for traders to capitalize on momentum trades.
While the DMI has its benefits, it’s crucial to consider its lagging nature and the likelihood of its generating false signals, necessitating the use of additional tools for confirmation and timing entries.
What Is the Directional Movement Index (DMI)?
The directional movement index (DMI) is a technical indicator widely used by traders in financial markets to assess whether upward pressure or downward pressure on price is more dominant. Developed by J. Welles Wilder Jr., the DMI also helps traders identify whether an asset is in a strong trend or a sideways consolidation phase.

The DMI consists of three components: the positive directional indicator (+DI), the negative directional indicator (−DI) and the average directional index (ADX). These components work together to provide traders with valuable information about the market's direction and strength to determine if the continuation of a trend is likely.
Directional Indicators (+DI and −DI)
The positive directional movement line (+DI) and negative directional movement line (−DI) are integral parts of the DMI. These indicators are used to gauge the strength of bullish and bearish trends, respectively.
The +DI measures the strength of an upward price trend, indicating the presence of bulls in the market. It calculates the difference between the current high and the previous high, but only if it’s positive. The resulting values are then smoothed over a specific period. The +DI can range from 0 to 100, with higher values suggesting a stronger bullish trend.
On the other hand, the −DI measures the strength of a downward price trend, signaling the presence of bears in the market. It follows a similar calculation as the +DI, but focuses on the difference between the current low and the previous low. Like the +DI, the −DI is also evened out over a particular period. Values range from 0 to 100, with higher values indicating a stronger bearish trend.
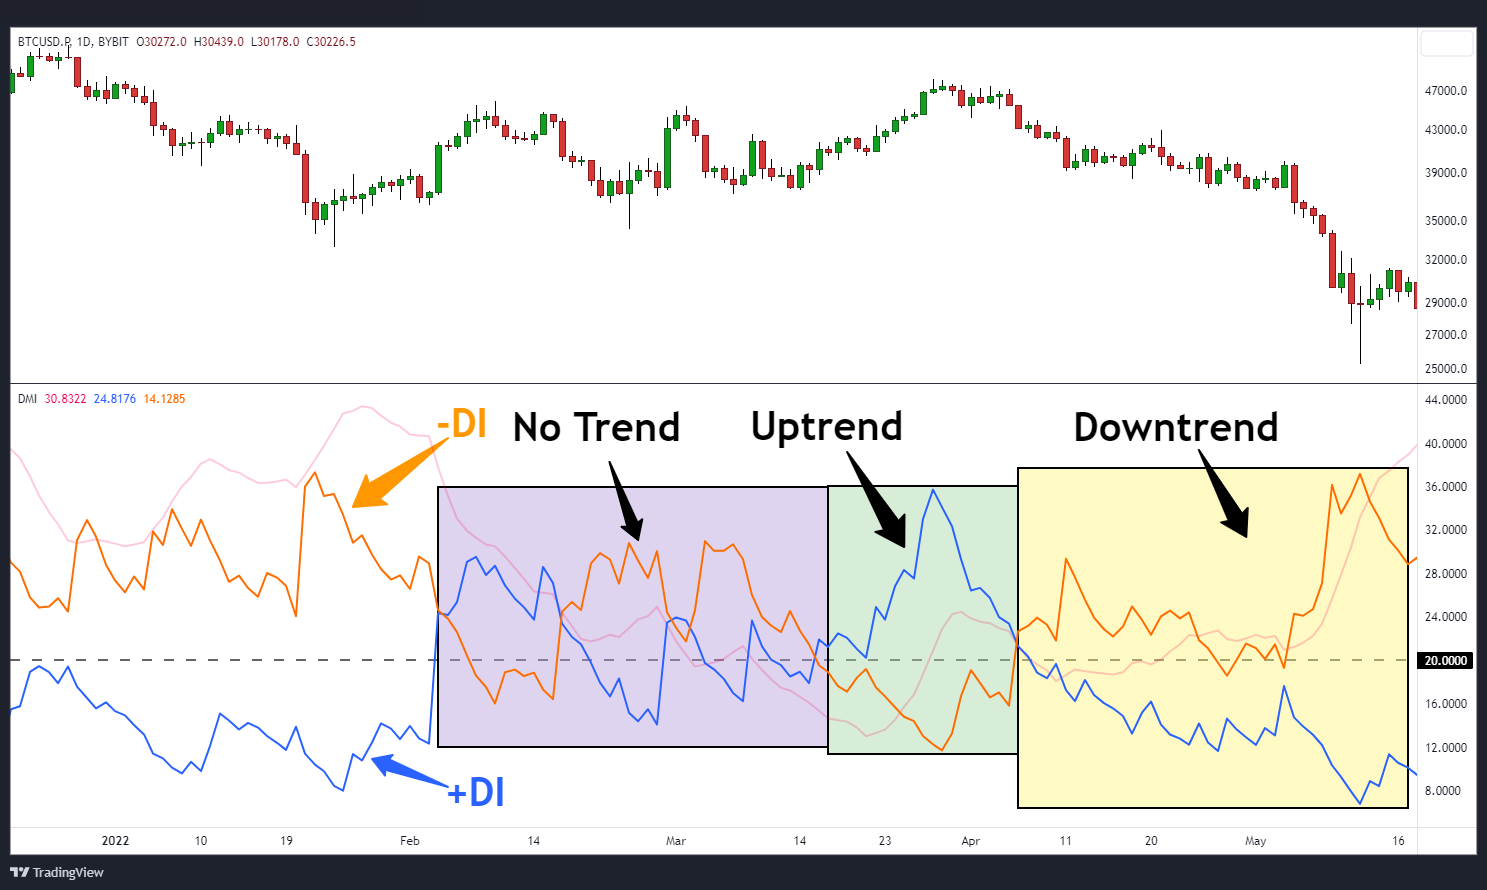
By comparing the +DI and −DI, traders can evaluate the battle between buyers and sellers. If the +DI is above the −DI, it suggests that the bulls have the upper hand, indicating the potential for more upward pressure — which means that traders may choose to take a long position.
Conversely, if the −DI is higher than the +DI, it indicates that the bears are dominating the market, suggesting the potential for more downward pressure in price, and traders may choose to go short.
Average Directional Index (ADX)
The average directional index (ADX) is the optional third line of the directional movement indicator. It quantifies the trend's strength as identified by the +DI and −DI. Unlike the directional indicators, the ADX doesn’t differentiate between bullish or bearish trends, instead focusing on the overall strength of the trend, regardless of direction.
The ADX is calculated by averaging or smoothing the difference between the +DI and −DI values over a specified period. The resulting values range from 0 to 100, with higher readings indicating a stronger trend. Traders often use a threshold, such as 20, to determine whether a trend is significant enough to warrant their attention.
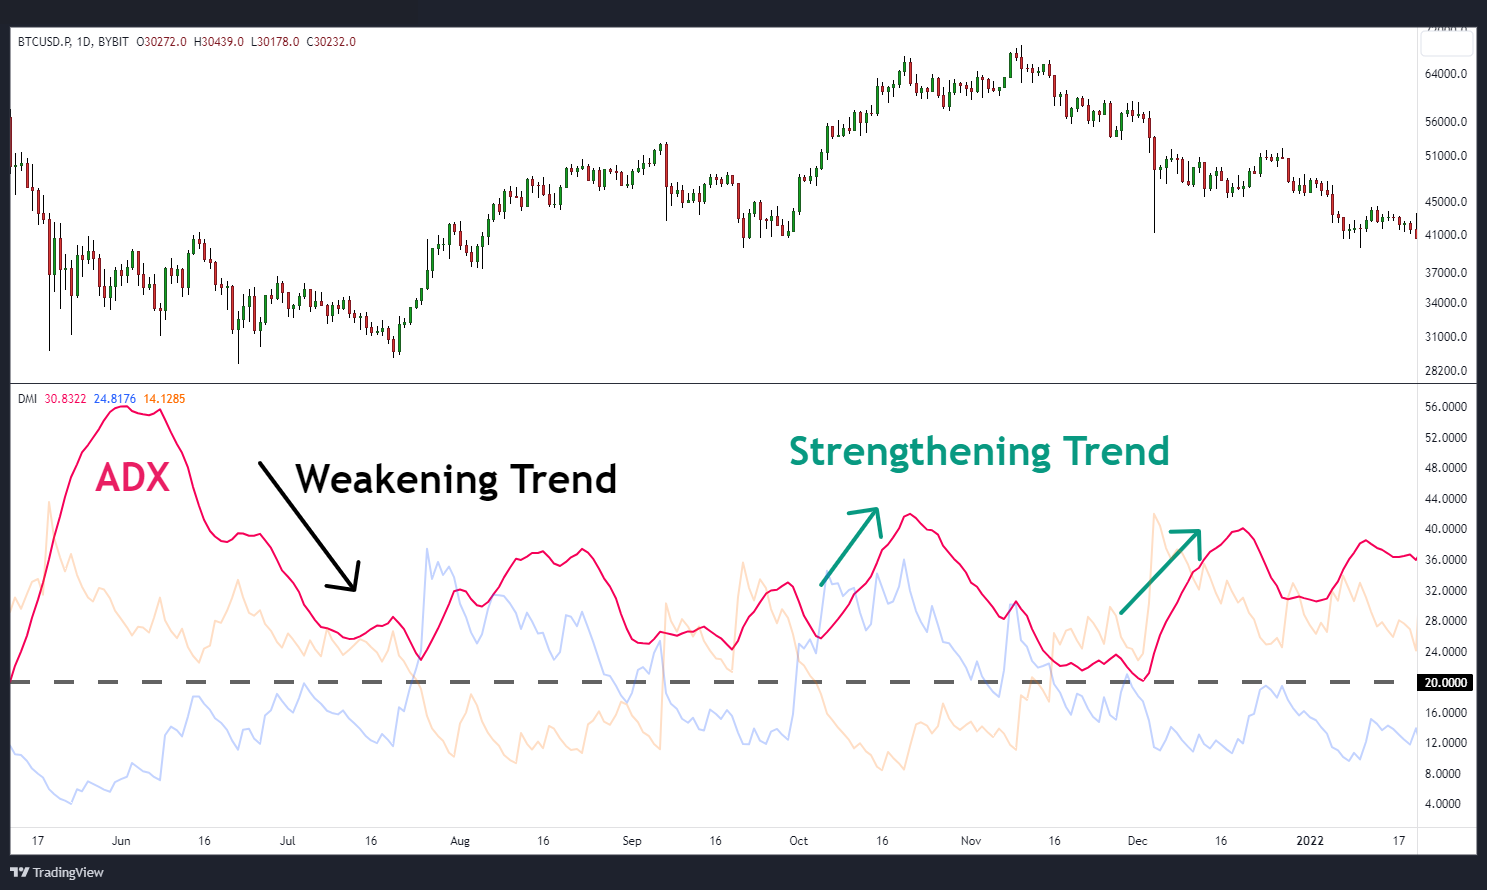
When the ADX is rising, it suggests that the market is trending strongly, regardless of whether it's an uptrend or a downtrend. Alternatively, a declining ADX may indicate a weakening trend or a period of consolidation. If the ADX is dropping, it’s advisable to implement a reversal or range-bound type of strategy involving other technical indicators to identify potential trading opportunities.
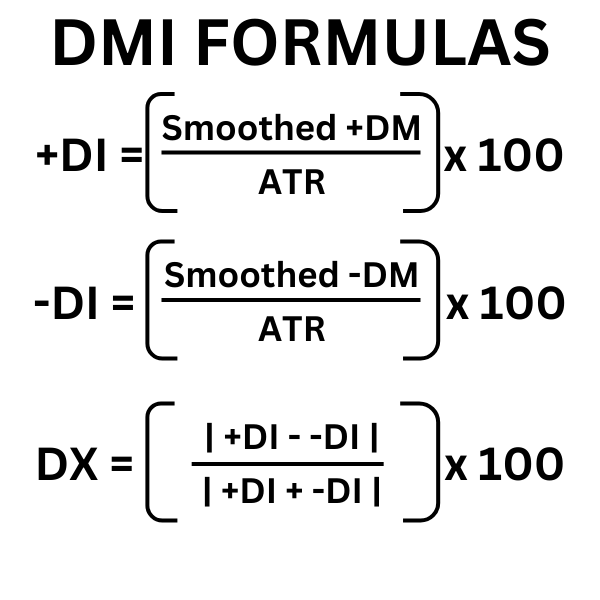
How to Calculate Directional Movement Index
The formula for the DMI appears intimidating. Fortunately, charting packages will automatically calculate this for you and apply it to a separate window at the bottom of your chart.
Calculating the DMI involves a series of steps that take into account the positive directional indicator (+DI), the negative directional indicator (−DI) and the average directional index (ADX). Here's a breakdown of the calculation process:
+DM (Directional Movement) = Current High − Previous High (PH)
−DM = Previous Low − Current Low
ATR = Average True Range
n = Number of periods (a common value is 14)
Calculate the ATR: It takes two steps to calculate the average true range (ATR).
Step 1: Calculate the true range by finding the maximum absolute value of the following three values:
Current high minus previous close
Current high minus current low
Current low minus previous close
Step 2: With the true range in hand, compute the ATR using the formula:
ATR = [(Previous ATR * (n − 1)) + True Range] / n periods.
Determine the Directional Movement (DM) for each period:
If the difference between the current high and the previous high is greater than the difference between the previous low and the current low, resulting in a positive value, +DM is set to that value.
If the difference between the previous low and the current low is greater than the difference between the current high and the previous high, and the result is a positive value, −DM is assigned that value.
Smooth the +DM and −DM values over a specified period (n): Use a moving average or exponential moving average to smooth the +DM and −DM values individually over the chosen period.
Calculate the +DI and −DI: Divide the smoothed +DM and −DM values by the smoothed ATR values, and multiply by 100 to get the percentage values for +DI and −DI.
Calculate the ADX: Smooth the absolute value of the difference between the +DI and −DI over a specified period to obtain the ADX.
What Does the DMI Indicator Tell You?
The DMI is a comprehensive indicator that reveals insights into market trends and their strength. Following are some key insights that the DMI indicator offers.
Trend Identification: DMI helps identify whether an asset is trending or in a sideways consolidation phase. By analyzing the +DI and −DI, traders can determine the prevailing trend. If +DI is above −DI, it suggests a potential uptrend, while the opposite indicates a possible downtrend.
Strength of Trend: The DMI's ADX quantifies the strength of a trend, regardless of its direction. A rising ADX indicates a strong trend, while a declining ADX suggests a weakening trend or a period of consolidation. Traders can use ADX to assess the significance of a trend and make informed trading decisions.
Entry and Exit Points: The DMI can help traders identify potential entry and exit points. During an uptrend, traders may consider entering long positions when the +DI crosses above −DI. Conversely, during a downtrend, a crossing of +DI below −DI may indicate a chance to enter short positions. Traders may also look for ADX readings above a certain threshold (e.g., 20) to confirm a trend's strength before making trading decisions.
How to Use DMI to Trade Trends
The DMI indicator has a trend strength gauge and directional filter built into it. Follow the guidelines below when trading a trend:
First, determine if there’s a strong trend. Look for the ADX line to be rising and near 20.
Next, determine if the +DI or −DI lines are turning higher. The line that turns higher and crosses above the other determines your trend direction.
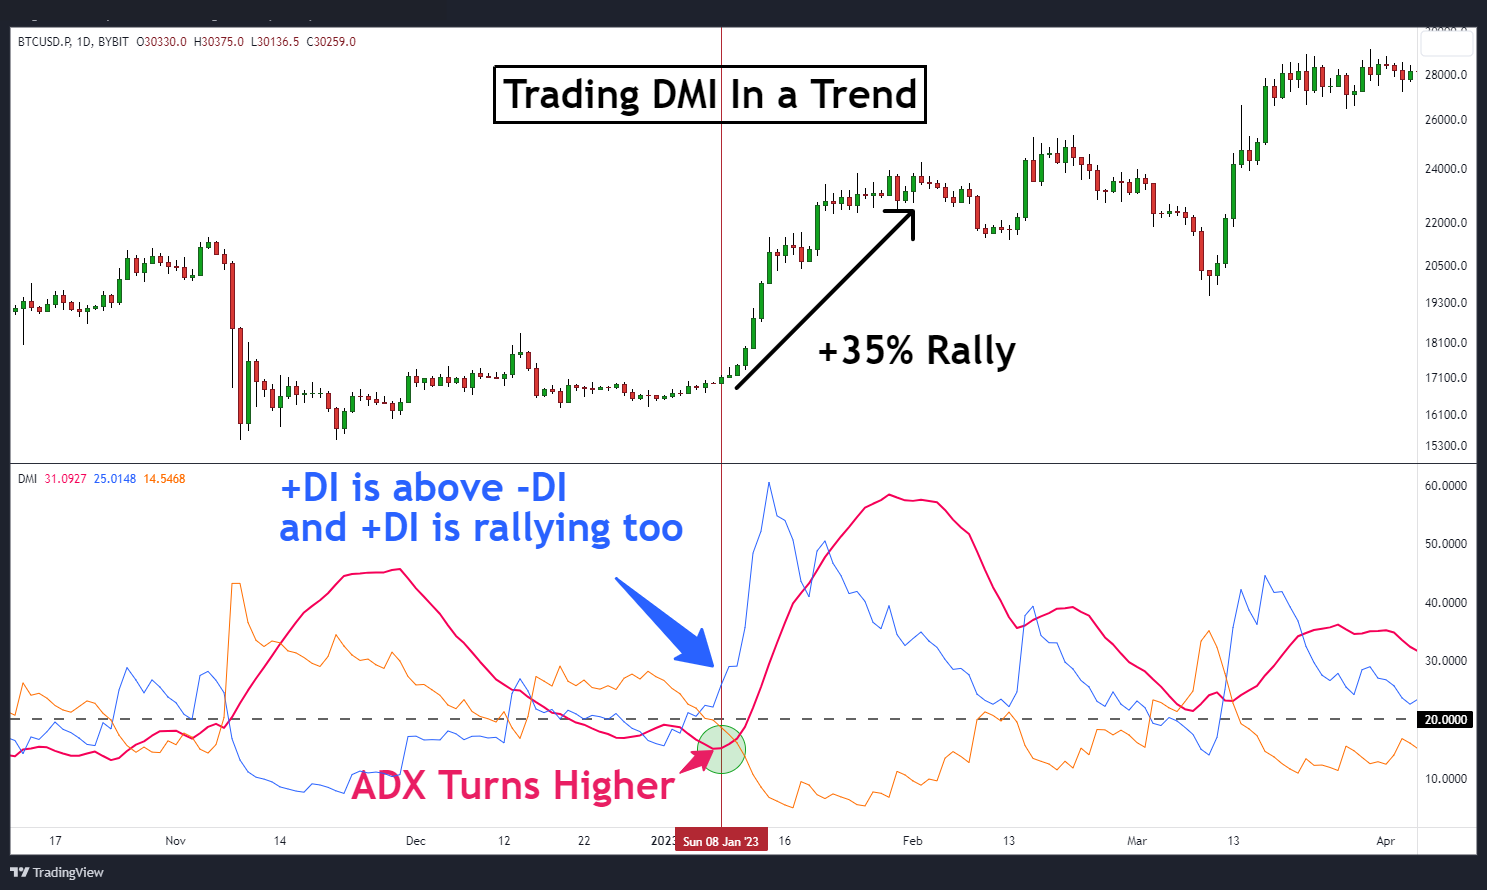
For example, on Jan 8, 2023, the ADX line for the BTCUSD.P chart is beginning to increase. At that time, the +DI line is rallying too, and has already crossed above the −DI line. This suggests the trend is gaining strength to the upside to give the trader the green light to place a long trade.
In this situation, you can use other technical tools to pinpoint the trade entry or place a buy breakout to position long, as Bitcoin is expected to rally. Indeed, Bitcoin experienced a significant rally by about 35% over the following month.
How to Use DMI to Trade Ranges
A range is essentially a non-trend. Therefore, if the ADX is declining, it signals the trend is losing momentum, and the conditions for a range or reversal to develop are increasing.
Once the conditions exist for a range to develop, you can identify support and resistance levels, and then look to buy at support and sell at resistance.
Additionally, a trader could consider an options strategy that capitalizes on sideways non-volatile pricing, such as a short strangle,short straddle or iron butterfly.
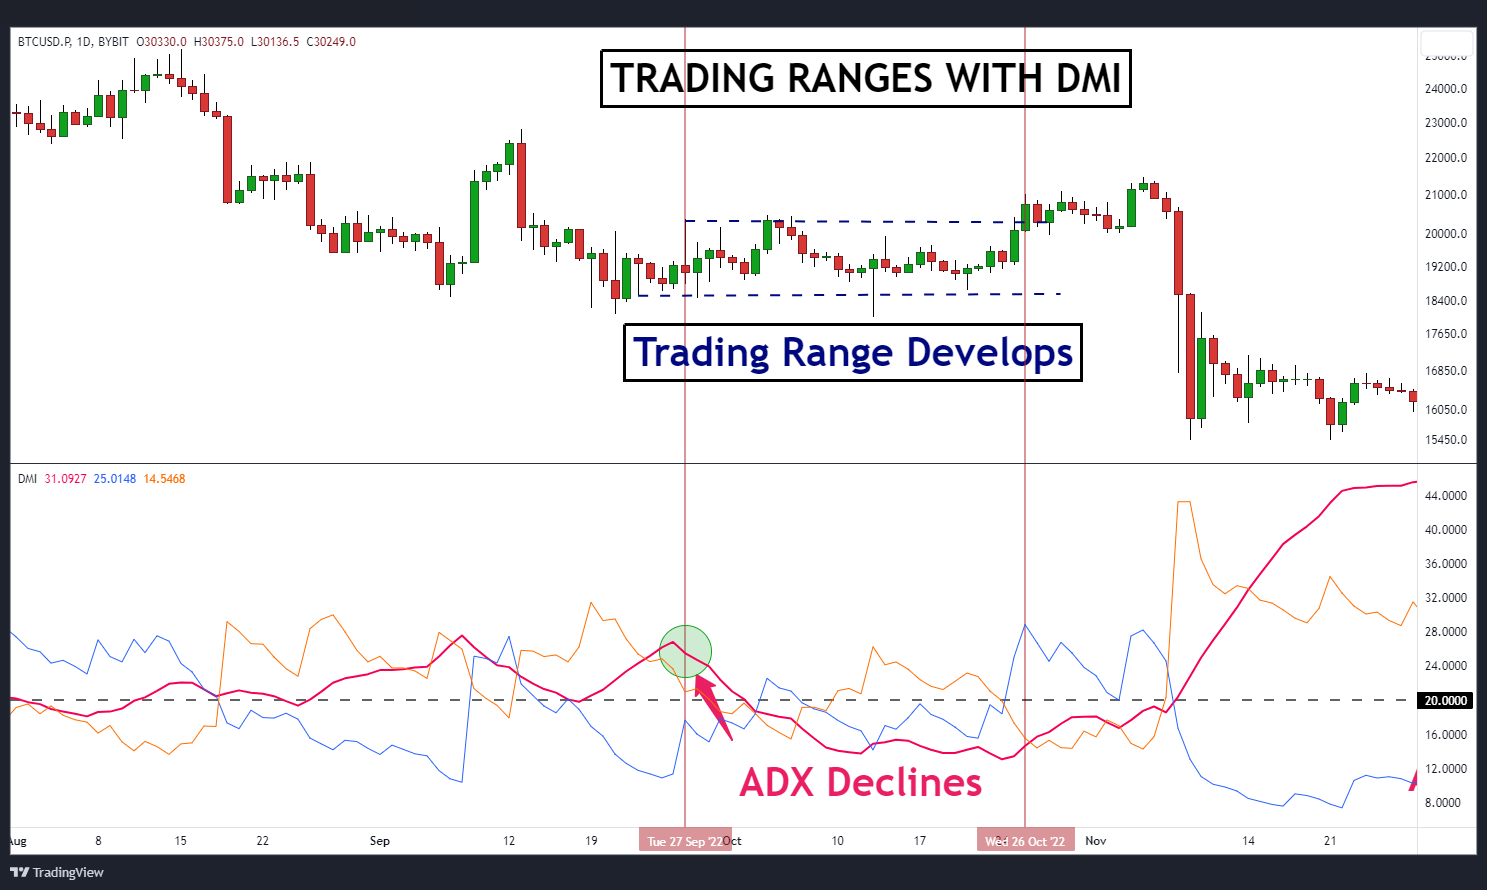
On Sep 27, 2022 (in the chart above), the ADX line for Bitcoin begins to decrease. This is a clue that volatility for Bitcoin is slowing down, and a period of consolidation will begin.
For the next month, Bitcoin prices did indeed consolidate between $18,600 and $20,400. A trader at that time would look to buy at support and sell at resistance.
Pros and Cons of the Directional Movement Index
The DMI offers several advantages for traders. First, it aids in identifying trends and providing valuable information for trend-following strategies.
Additionally, the ADX component quantifies trend strength, helping traders gauge the significance of a trend. Furthermore, +DI and −DI crossovers serve as potential entry and exit signals, assisting traders in timing their trades effectively.
However, there are some limitations to consider. The DMI is a lagging indicator, meaning it may generate delayed signals during periods of high market volatility after the market has already started trending.
In addition, it can produce false signals, particularly in choppy or range-bound markets. If you suspect a range-bound market is developing, consider incorporating other technical analysis tools for timing entries.
Reflecting on these pros and cons, traders can make informed decisions when incorporating the DMI into their trading strategies.
The Bottom Line
In conclusion, the directional movement index (DMI) is a valuable technical indicator that traders use to assess price movement trends. Even though the DMI can help traders make well-timed trading decisions, they need to be mindful of the lagging nature of the DMI and the potential for false signals.
#Bybit #TheCryptoArk