
EMA vs. SMA: Which Moving Average Is Better?

Moving averages are popular technical indicators used in trading to identify trends and potential pivot points. In this article, we’ll explore two commonly used moving averages: the simple moving average (SMA) and the exponential moving average (EMA). We’ll discuss when to use them, and their advantages and differences so you can be better informed on which moving average to use in your strategy.
Key Takeaways:
Moving averages help smooth out price data and identify trends and potential pivot points.
Simple moving average (SMA) gives equal weighting to each data point, making it suitable for longer-term trend identification.
Exponential moving average (EMA) places more weight on recent data, making it more responsive to current market conditions.
What Is a Moving Average?
A moving average is one of the most popular tools used in technical analysis. It’s applied to a chart in order to smooth out price fluctuations by calculating the average price over a specified period, so that traders can identify trends and potential pivot points.
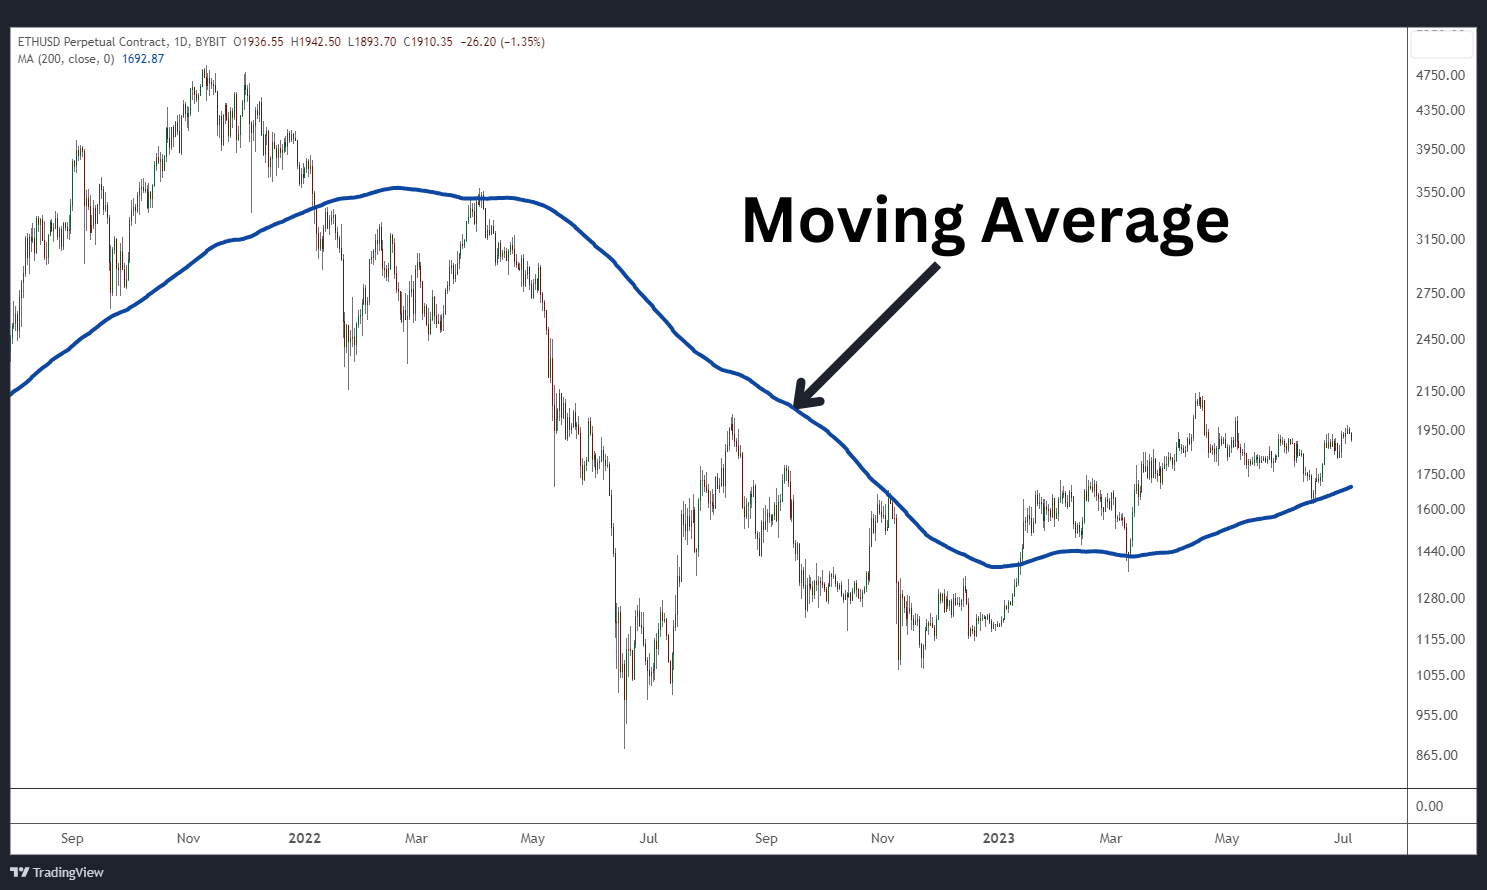
The moving average appears as a line over the chart’s price action. It’s a versatile technical indicator that can be applied to any chart time frame, from short-term intraday charts to long-term weekly or monthly charts. Traders rely on the valuable insights moving averages provide, such as determining the overall trend direction and filtering out market noise to make more informed trading decisions.
There are several different types of moving averages, but our focus here is on SMA and EMA.
What Is a Simple Moving Average (SMA)?
One of the most commonly used types of moving averages is the simple moving average (SMA). Its calculation is straightforward and provides a reliable representation of previous price data. Large institutions use SMA to analyze long-term price trends.
When to Use Simple Moving Average
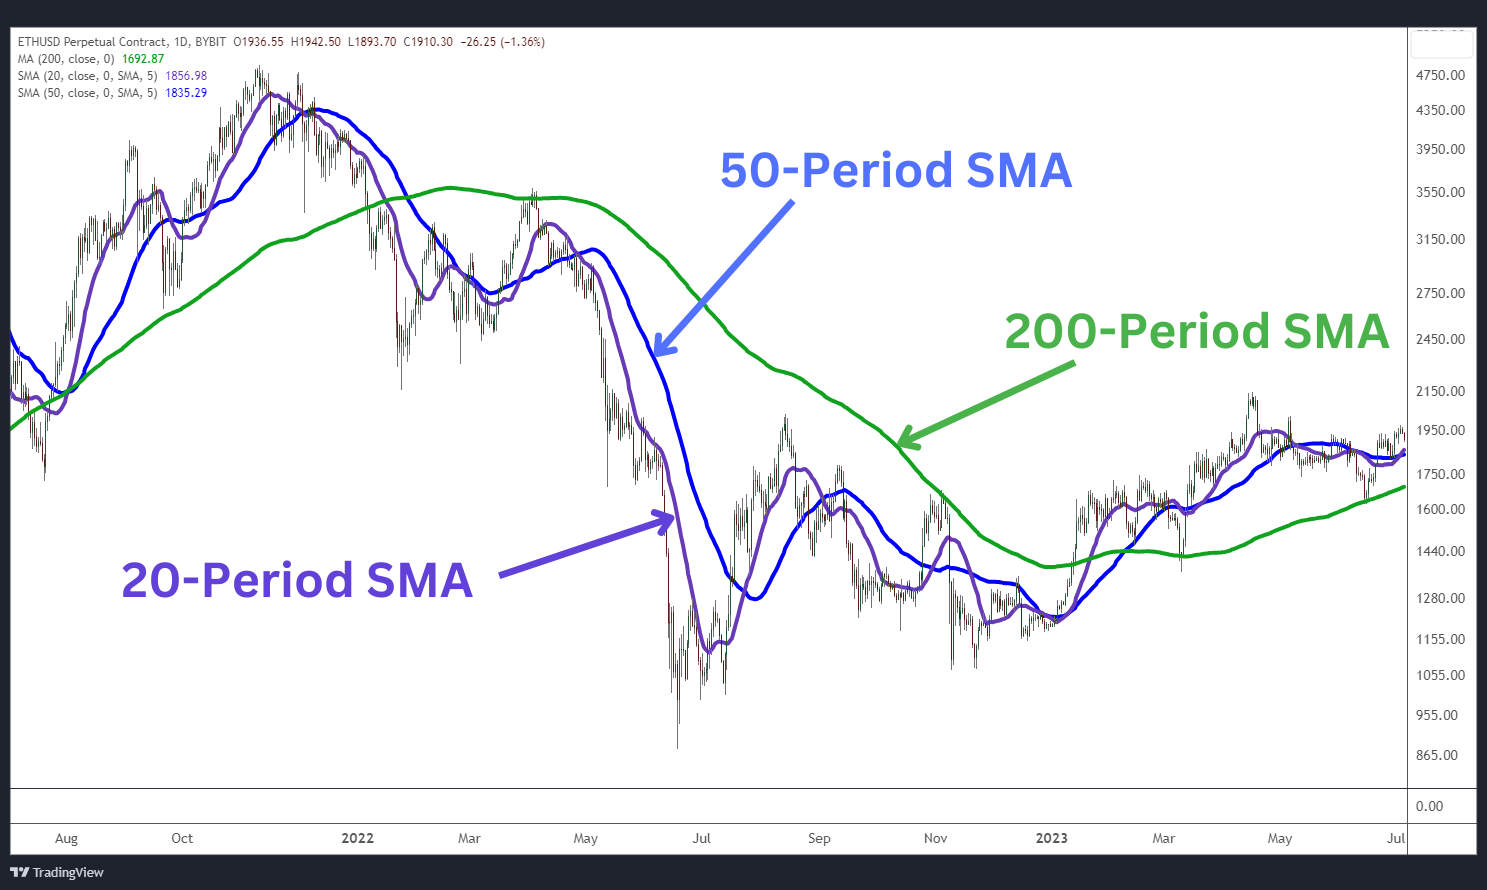
Many traders use SMA when identifying trends that are longer-term in nature. As a result, it’s often applied on daily, weekly or monthly time frames, with an input value of 10, 20, 50 or 200.
Simple moving average gives equal weight to each data point in the price series. This means that recent prices have the same weight in the calculation as older data points. As a result, SMA is slower to respond to dramatic price swings.
Traders often use SMA in combination with other technical analysis tools to confirm or validate signals. For example, if a trading strategy includes multiple time frame analysis, most traders will use a 200-period SMA on the larger chart time frame to act as the long-term average for identifying trends.
When the price of an asset is consistently above the SMA, it suggests an uptrend, indicating a potential buying opportunity. Conversely, when the price consistently stays below the SMA, it indicates a downtrend, signaling a probable selling opportunity.
Day traders may incorporate smaller input values into their SMA, such as a 10- or 20-period. This helps speed up the moving average to be more sensitive to price movements for responding quickly on any short-term trades.
Lastly, crossovers between different SMA periods have been a popular strategy, shared on the web, for generating trading signals. However, the SMA crossover trading strategy is prone to being late to new trends, so be extremely careful if you’re considering it.
How to Calculate Simple Moving Average
SMA is calculated by summing up the closing prices of an asset over a specific number of periods, and then dividing the sum by the number of periods. Calculating SMA is a simple mathematical formula, and fortunately, you don’t need to memorize it, as current-day charting packages will automatically perform the calculation for you.
For example, to calculate a 10-day SMA, you would add up the closing prices of the asset for the past 10 days and divide the sum by 10. Each day, the oldest closing price is dropped, and the newest closing price is added to the calculation, creating a moving average that continuously adapts to recent prices.
Here are the steps to calculate a simple moving average:
Determine the number of periods you want to use for the moving average (e.g., 10, 50 or 200).
Add up the closing prices of the asset for the specified number of periods on the most recent price data.
Divide the sum by the number of periods.
Now, let's calculate a 10-day SMA with the following closing prices: $25, $27, $26, $28, $29, $31, $30, $29, $28 and $27.
Sum of closing prices = $25 + $27 + $26 + $28 + $29 + $31 + $30 + $29 + $28 + $27 = $280
10-day SMA = $280 / 10 = $28
By repeating this process for each trading day, you can plot the SMA on a chart to visualize the average price movement over the specified period.
Remember, the choice of SMA period depends on your strategy and the time frame you’re analyzing. Shorter periods respond more quickly to price changes, while longer periods provide a smoother average that reflects more significant trends.
What Is an Exponential Moving Average (EMA)?
In addition to the simple moving average, another popular technical analysis indicator is the exponential moving average. While similar to SMA, EMA places more weight on recent data, making it more responsive to current market conditions.
EMA calculation differs from SMA in that it incorporates a smoothing factor that exponentially decreases the weight of older price data. This means that EMA gives greater importance to the current price, allowing it to respond quickly to changes in market trends.
When to Use Exponential Moving Average
EMA is particularly useful for traders who prefer to focus on short-term trends and price action. Due to its emphasis on recent prices, EMA is better suited for capturing and reacting to rapid price changes than SMA. Following are some scenarios in which EMA can be beneficial.
Identifying Trend Changes: EMA can help traders spot potential trend reversals earlier than simple moving averages. As EMA reacts more quickly to price movements, it can provide timely signals when a trend is about to change direction.
Riding Momentum: Traders who aim to capitalize on short-term price swings and momentum often rely on EMA. By using shorter EMA periods, they can quickly enter and exit trades based on immediate price action.
Trading Breakouts: Breakout traders look for price movements that break through key support or resistance levels. Since EMA responds more quickly, a price break above it signals a bullish trend, while a break below EMA signals a potential bearish trend.
How to Calculate Exponential Moving Average
Calculating EMA involves a slightly more complex formula as compared to SMA. The formula incorporates a multiplier that determines the weight of each price data point. Following are the steps to calculate EMA:
Determine the number of periods you want to use for the EMA.
Calculate the smoothing factor (SF) using the following formula: SF = 2 / (N + 1), where N represents the number of periods.
Start with the first period's SMA as the initial EMA value.
For each subsequent period, calculate EMA using the following formula: EMA = (Current Price − Previous EMA) × SF + Previous EMA
Repeat this calculation for each period, updating the EMA value accordingly.
Using the above formula, let's calculate a 10-day EMA for a stock with the following closing prices: $25, $27, $26, $28, $29, $31, $30, $29, $28 and $27.
We’ll calculate a 10-period EMA.
Determine the smoothing factor: SF = 2 / (10 + 1) = 0.1818
Start with the 10-day SMA as the initial EMA value: EMA = $28
Calculate the 10-day EMA for the second period: EMA = ($27 − $28) × 0.1818 + $28 = $27.1818
Repeat this calculation for each subsequent period to obtain the EMA values.
By plotting EMA on a chart, traders can visually analyze the relationship between the price and the EMA line to identify potential trading opportunities and make informed decisions.
Remember, the choice of EMA period depends upon the strategy and the desired level of responsiveness to price changes. Shorter EMA periods react more quickly but may be more susceptible to false signals, while longer EMA periods provide a smoother average but respond more slowly to price movements.
Key Differences Between EMA and SMA
While both exponential moving average (EMA) and simple moving average (SMA) are commonly used in technical analysis, they have some key differences. Here's a comparison table highlighting their distinctions.
EMA | SMA | |
Calculation | Exponential weighting — giving more weight to recent price action | Equal weighting — provides equal weight to all price data |
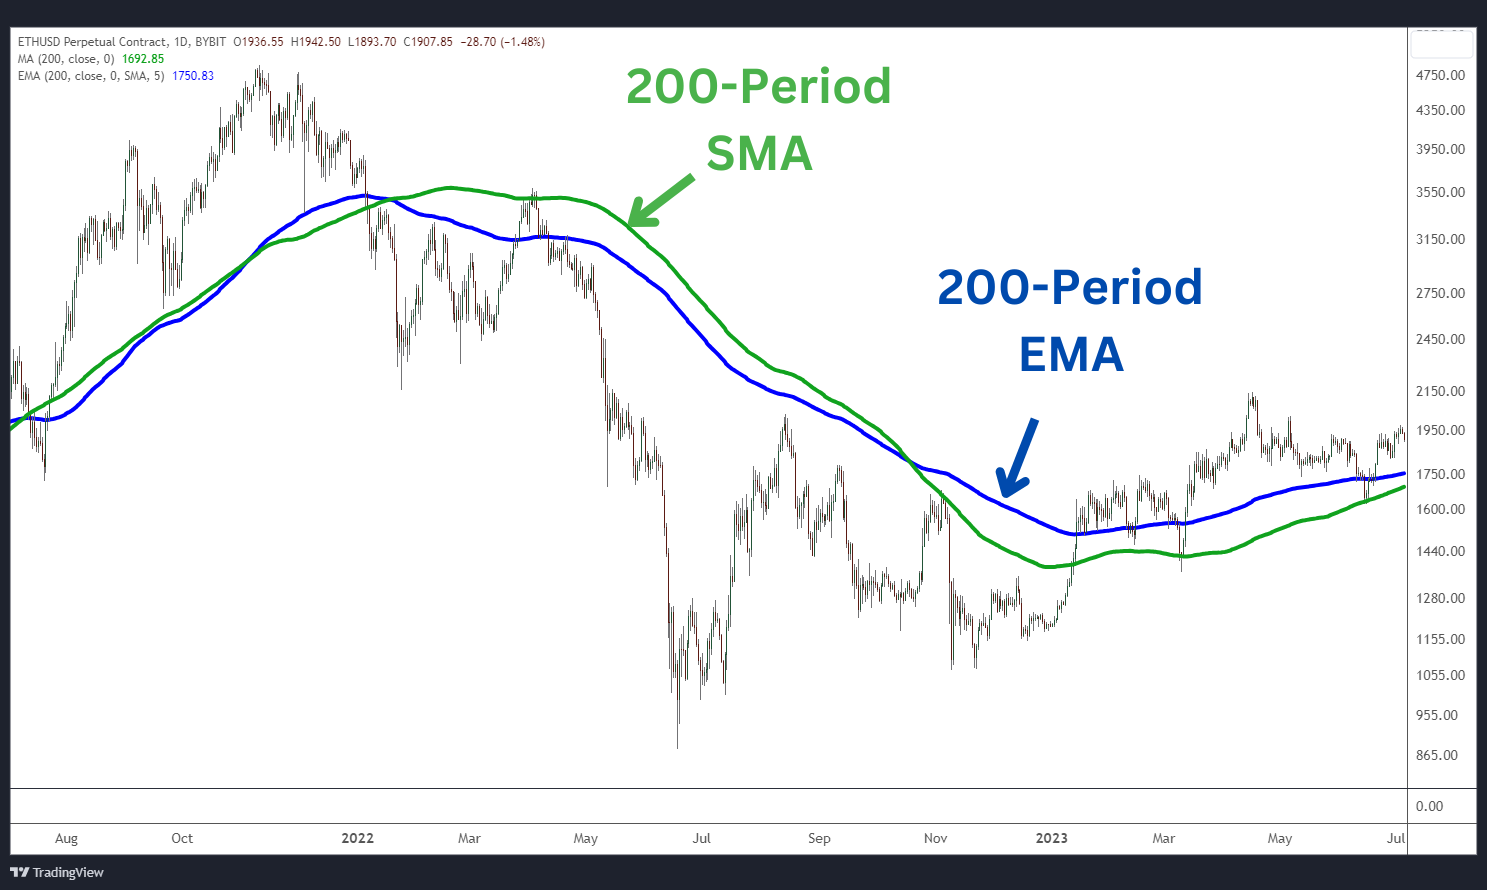
Responsiveness | More responsive to recent price changes | Less responsive to recent price changes |
Lag | Less lag compared to SMA | More lag compared to EMA |
Line Smoothness | May result in more erratic fluctuations as it’s more responsive | Provides a smoother and more stable signal line |
Advantages of EMA Over SMA
EMA has several advantages over the SMA, which make it a popular choice for many traders.
Responsiveness: EMA responds quickly to current price changes, allowing traders to capture trends and potential trading opportunities more promptly.
Timely Signals: Due to its emphasis on current prices, EMA can provide timely signals for trend reversals and entry/exit points in the market.
Reduced Lag: EMA has less lag than SMA, enabling traders to make faster decisions based on current market conditions.
Advantages of SMA Over EMA
Although EMA has its strengths, SMA also offers unique advantages:
Simplicity: The calculation of SMA is straightforward, making it understandable to traders of all experience levels.
Smoothness: SMA provides a smoother and more stable signal line, reducing the impact of short-term price fluctuations and providing a clearer overall trend picture.
Reliability: SMA is more widely followed, from the small trader to the large institution. This makes signals surrounding it more reliable.
Which Moving Average Is Better for Day Trading?
Though both moving averages are used for day trading, whereby traders aim to capitalize on short-term price movements within a single trading day, exponential moving averages are often preferred. Their responsiveness to recent price changes allows day traders to quickly identify and react to intraday trends and price reversals, providing more timely entry and exit signals.
Which Moving Average Is Better for Swing Trading?
When it comes to swing trading, a strategy that involves capturing medium-term price movements over several days to weeks, both exponential moving averages and simple moving averages can be effective. The choice between EMA and SMA depends upon the trader's preference. EMA's responsiveness to current prices can help swing traders identify shorter-term swings and capture smaller price moves. On the other hand, many swing traders incorporate some type of multiple time frame analysis, making the SMA's smoothness and stability more reliable and providing a clearer picture of the overall trend.
Final Thoughts
Simple moving averages and exponential moving averages are valuable technical indicators. Each moving average has its advantages and suitability for different trading strategies and time frames. SMA provides a smoother and more stable signal line, making it reliable for longer-term trend identification. On the other hand, the EMA's responsiveness to recent price changes is well-suited for shorter-term trend identification and capturing shorter price swings. By understanding the differences between and advantages of these two types of moving averages, traders can enhance their analysis and make more informed trading decisions.
#Bybit #TheCryptoArk