
Can the Buffett Indicator Effectively Measure Crypto Market Valuations?

The Buffett Indicator (BI) is a tool used by long-term investors to determine if the current stock market pricing is overvalued or undervalued. It’s a relatively simple calculation that compares the total stock market value to the economic output of the nation.
Theoretically, we can also use the Buffett Indicator to understand the relative valuation of the crypto market. However, there are extensive differences between the stock market and the crypto market which make comparisons with the Buffett Indicator challenging.
Key Takeaways:
The Buffett Indicator helps long-term investors assess stock market valuation by calculating the ratio of total market value to the nation's economic output.
Theoretically, the Buffett Indicator could be used to gauge crypto market valuation by comparing the total market cap of crypto against GDP.
The Buffett Indicator as it applies to crypto has limitations due to market differences, such as a lack of extensive historical data to compare.
What Is the Buffett Indicator?
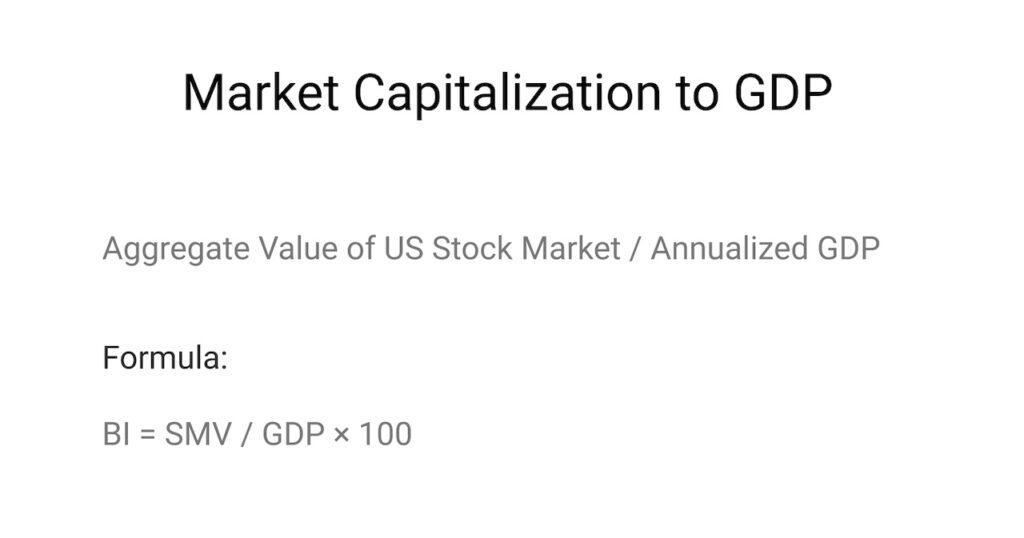
The Buffett Indicator (or the ratio of market capitalization to GDP) is a valuation used to determine if the aggregate stock market is relatively cheap or expensive at a given point in time.
The idea behind the indicator is that the value of a company’s share price will follow the rise and fall of the nation’s economic production. The Buffett Indicator is a longer-term model, as the stock market can remain far away from reasonable valuations for extended periods. The indicator is named after famed investor Warren Buffett, chairman and CEO of Berkshire Hathaway, who is known for buying and holding investments for decades at a time.
At one point, it was rumored that Warren Buffett called this ratio of market cap to GDP “the best single measure of where valuations stand at any given moment.” We don’t know for sure if Mr. Buffett did make those comments.
However, in the last 15 years, a series of dynamic factors — including suppressed and negative interest rates, unprecedented government stimulus in response to the pandemic and rapid fluctuations in interest rates — have contributed to a volatile trend in stock market valuations.
The BI Calculation of Market Valuation (CMV)
The Buffett Indicator is the ratio of the total stock market valuation to GDP. For example, if the aggregate value of all assets on the U.S. market adds up to $40 trillion, and the value of all goods and services produced in the United States is $20 trillion, then the value of the stock market is twice that of the U.S. GDP, meaning the Buffett Indicator would produce a value of 200%.
If the economy is expanding, then the underlying businesses’ share prices will likely bid higher. If for some reason, the underlying businesses are not growing — even though the economy is becoming larger — the stock market at that moment is relatively cheap.
During deflationary times, GDP typically falls aggressively. As a result, the market’s valuation tends to fall with the GDP. In this case, it can be difficult to decipher if stocks are cheap and, therefore, a good buy. An analyst can determine if the overall market is inexpensive when the Buffett Indicator has fallen to historically low levels.
Once investors bid up the share prices, the value of the stock market tends to increase faster than the GDP, and the Buffett Indicator rises until it reaches a relatively expensive valuation.
Market Total Value
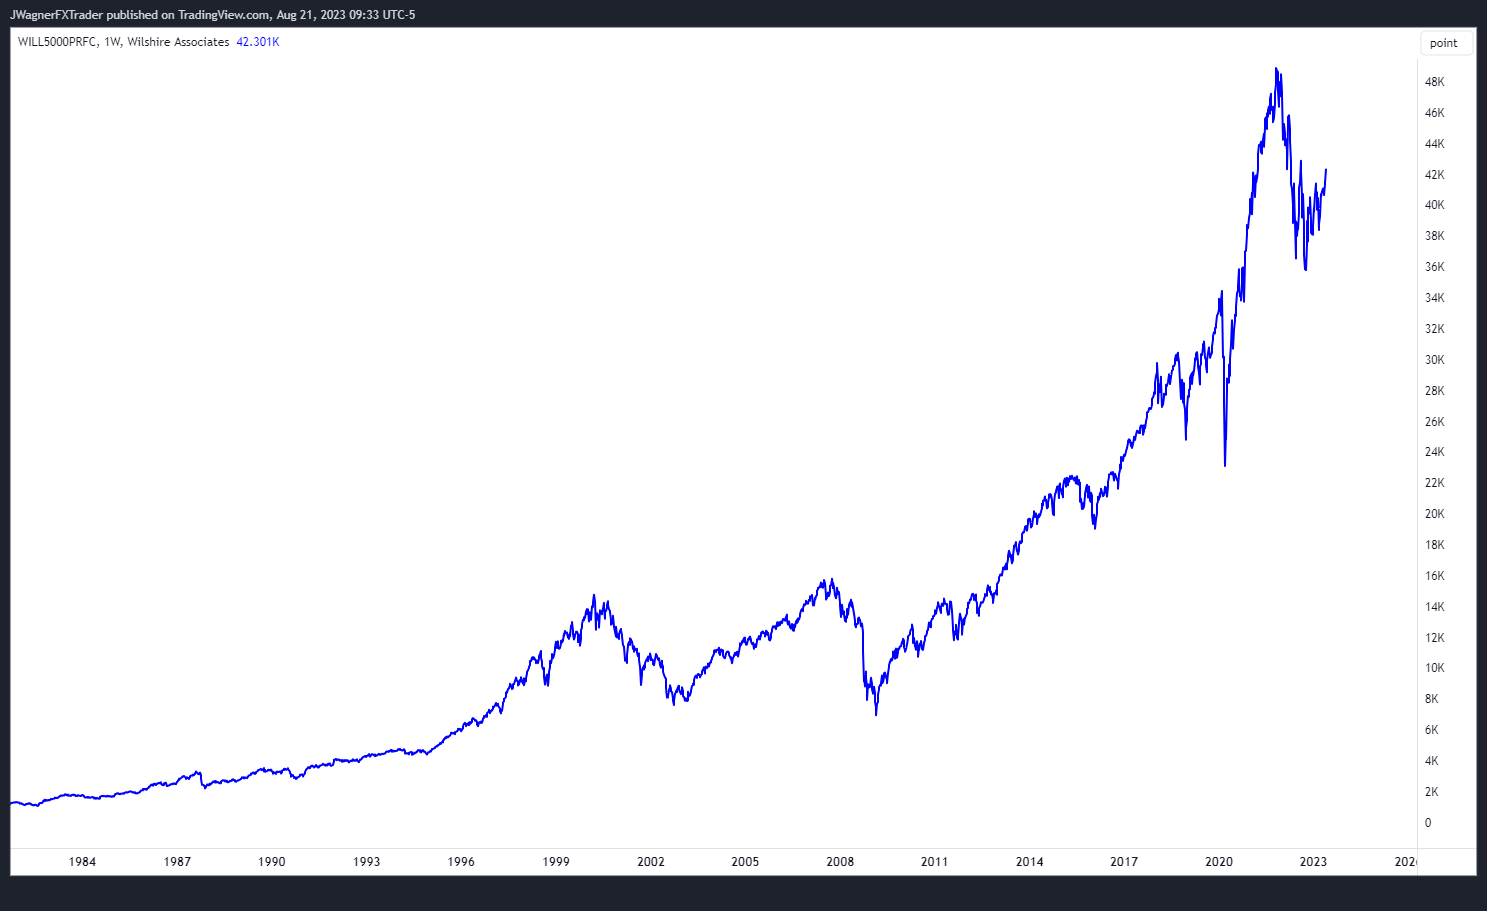
The numerator of the ratio is the total market value. It’s common to use the Wilshire 5000 index as a proxy for the market’s value, providing a good cross-section of the total economy.
As of August 2023, the Wilshire 5000 Index has a market value of $42.3 trillion.
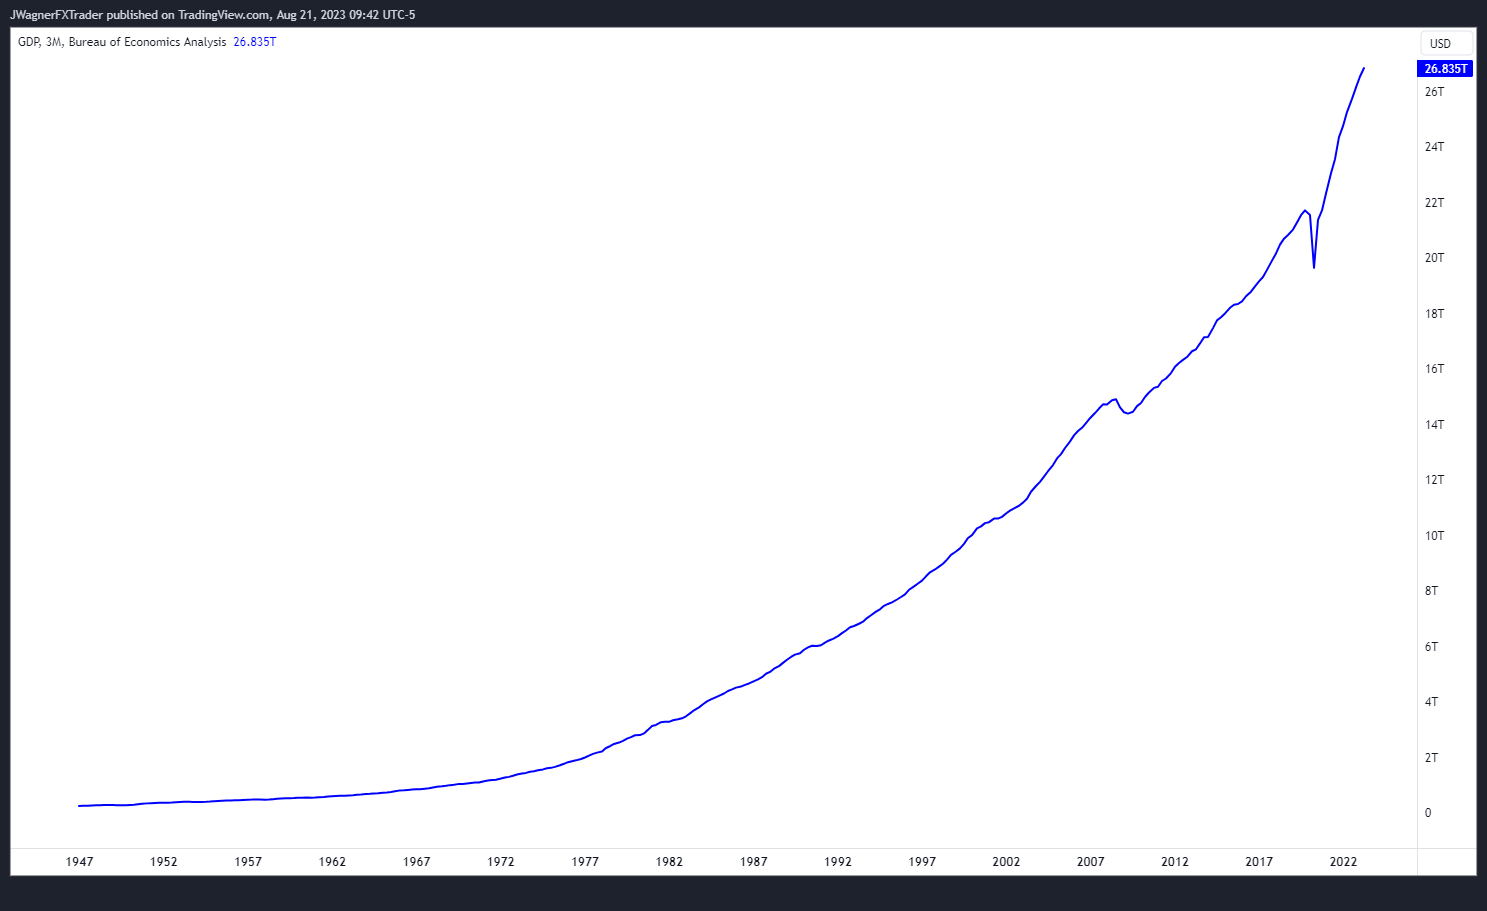
Measuring the GDP
Gross Domestic Product, or GDP, is an economic term used to describe an economy’s size. An increasing GDP typically means that the economic activity of that nation is healthy and growing. On the other hand, a shrinking or stagnating GDP suggests the nation is struggling, and the economy is not healthy.
GDP is a backward-looking statistic that does not forecast. Just because the GDP is at a certain level doesn’t mean the economy will grow or shrink. The data that goes into the GDP’s calculation is complex, and it can take several months after the fact to provide accurate figures for how vibrant the economy was at the time of calculating.
Stock Market vs. Crypto Market
The Buffett Indicator was created to be a stock market valuation tool. Could it be useful within emerging markets like the crypto market as well?
Theoretically, we can create a Buffett Indicator for crypto. The types of data and statistics used within the stock market can also be found for cryptocurrencies. For example, the denominator of the calculation is GDP. This remains the same whether you’re implying the concept in stocks or cryptocurrencies.
The numerator of the Buffett Indicator is the total size of the U.S. stock market or the market capitalization. We can also determine the market capitalization of the crypto market.
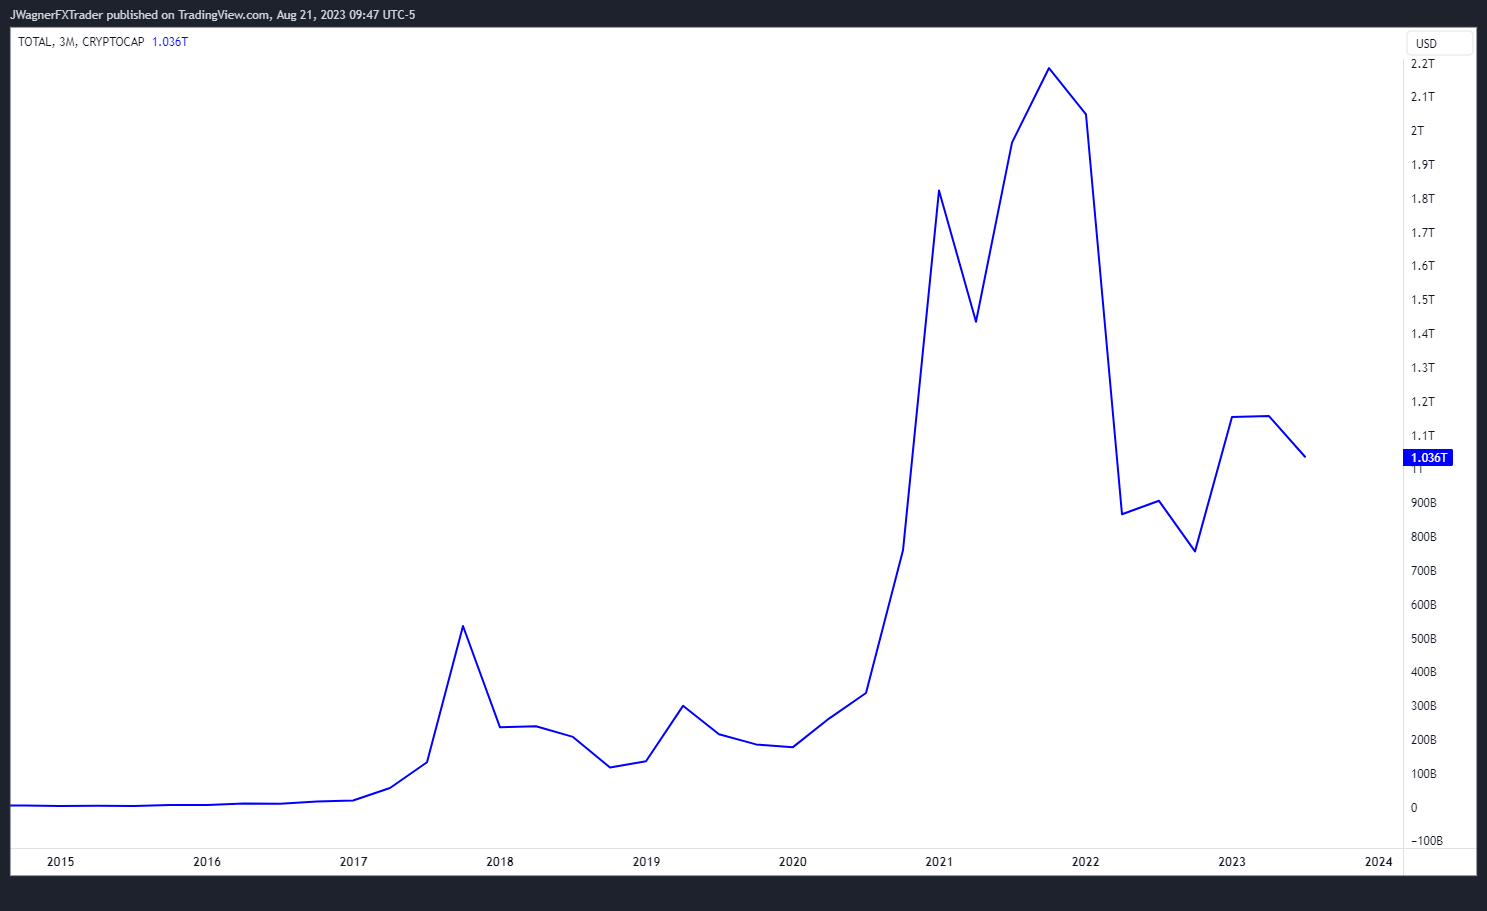
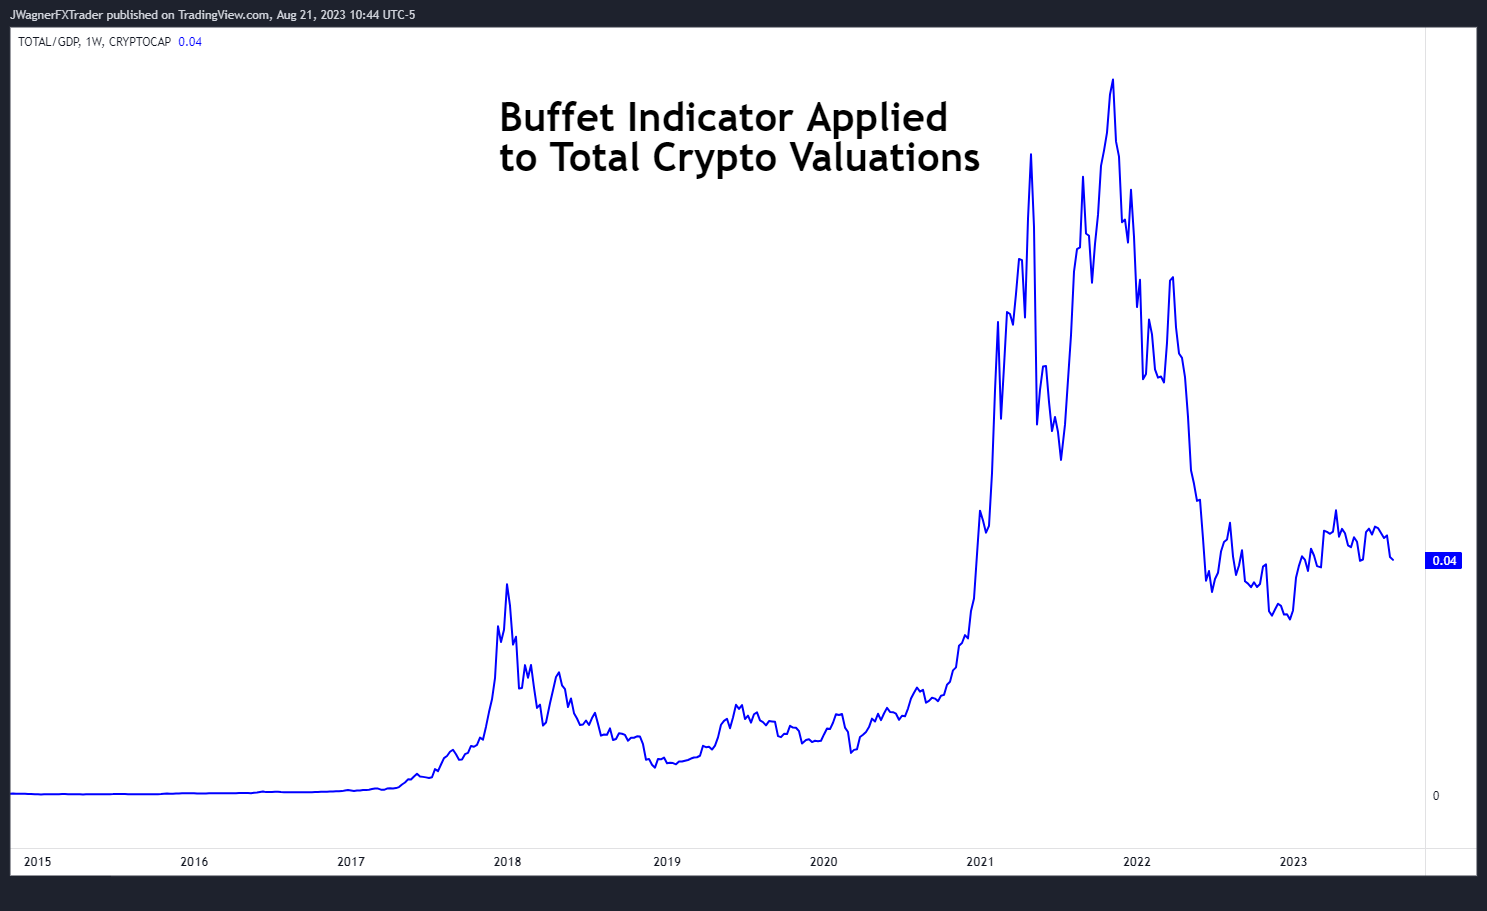
The chart above shows the total market cap of all cryptocurrencies in the world, which currently stands near $1 trillion.
Therefore, if you want to create a Buffett Indicator for crypto, simply take the total crypto market cap and divide it by the GDP. Yes, the Buffett Indicator in crypto is possible.
But is it practical?
Evaluating Market Valuation
When we combine the stock market valuation with the GDP to create the Buffett Indicator, we get a result that looks like this:
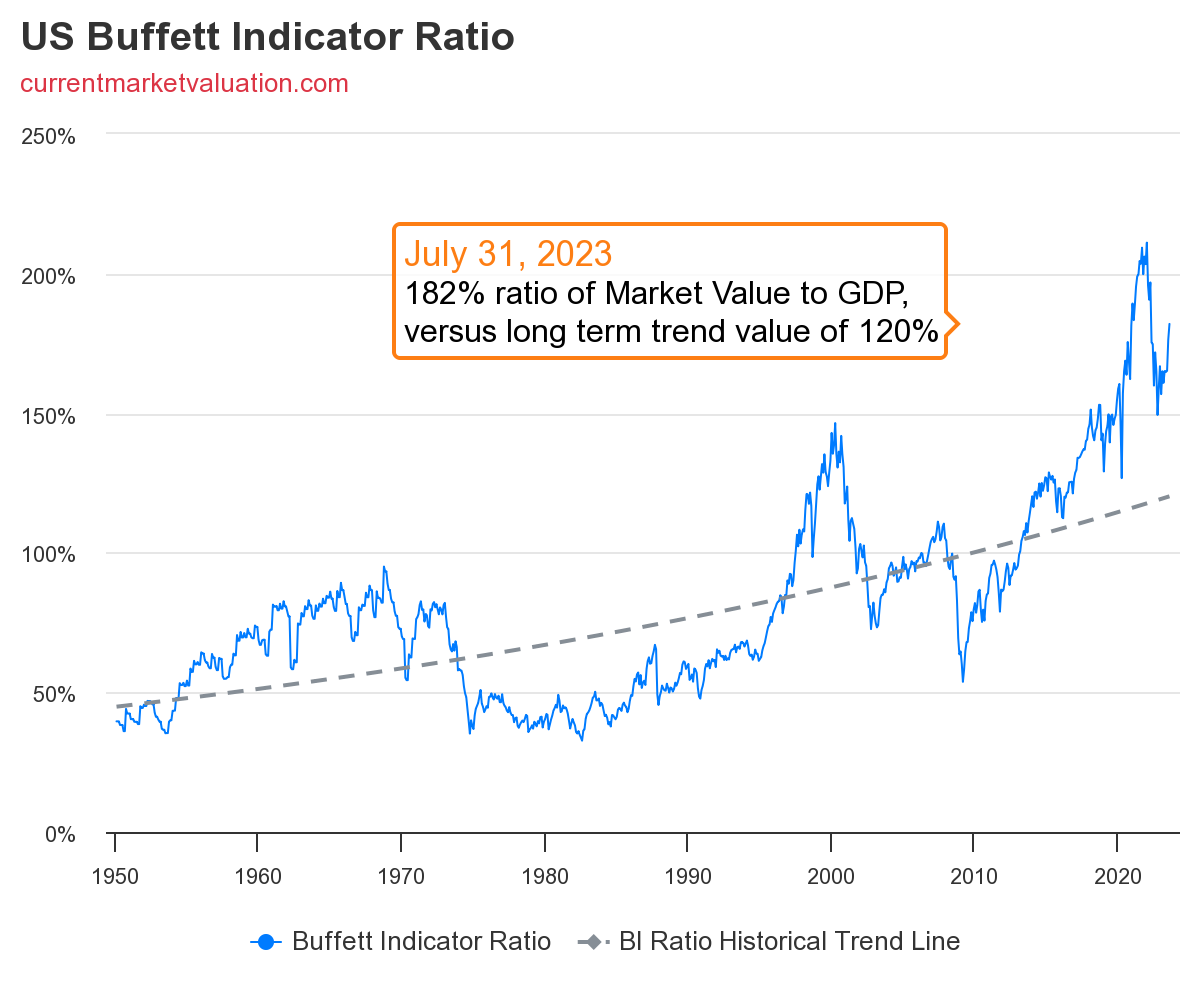
Growth in GDP should create growth in total market valuations, and vice versa. When the figures aren’t moving in the same direction at the same speed, then you tend to see peaks and valleys within the Buffett Indicator’s trend.
Until the mid-1990s, the Buffett Indicator oscillated between 40% and 100%. Then, as the internet bubble began to heat up, the Buffett Indicator accelerated to 150%. The 2008 financial crisis and credit squeeze brought the indicator back down toward normal levels, near 50%.
Since then, the indicator has climbed to a high of 200% and a recent low of 150%.
A Real Case Example
Increasing efficiency and improvement in technology within the economy would naturally drive the Buffett Indicator higher. As a result, an exponential trend line is added to the Buffett Indicator to accommodate these improvements.
Let’s adjust the chart to make the exponential trend line the new base. Then, any values above the trend line would show a positive deviation, and any value below the trend line is considered a negative deviation.
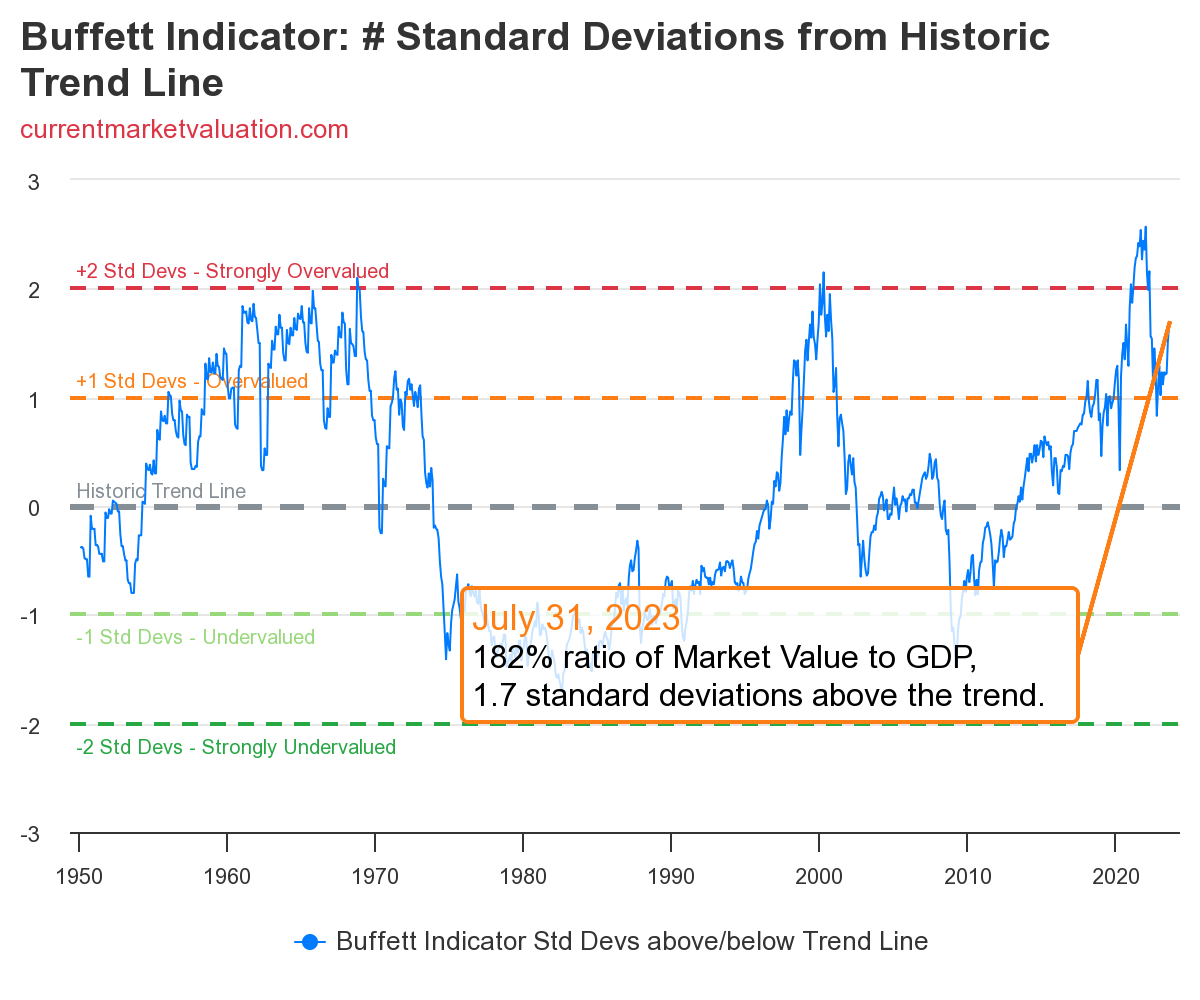
Any positive deviations are above trend and considered expensive, while negative deviations are considered cheap.
Valuations near the middle of the chart are near their exponential average and are seen as fairly valued.
The Buffett Indicator reached extremely low levels in the mid-1970s–80s and, most recently, during the 2008 financial crisis. At these times of inexpensive valuations, the market pricing was considered cheap and a good value.
On the flip side, extremely high valuations were witnessed at the peak of the 2000 internet bubble. While valuations peaked in 2021 and have since experienced a decline, it's worth noting that the Buffett Indicator continues to surpass the levels observed during the high in 2000.
What to Do When the BI Ratio Is High or Low
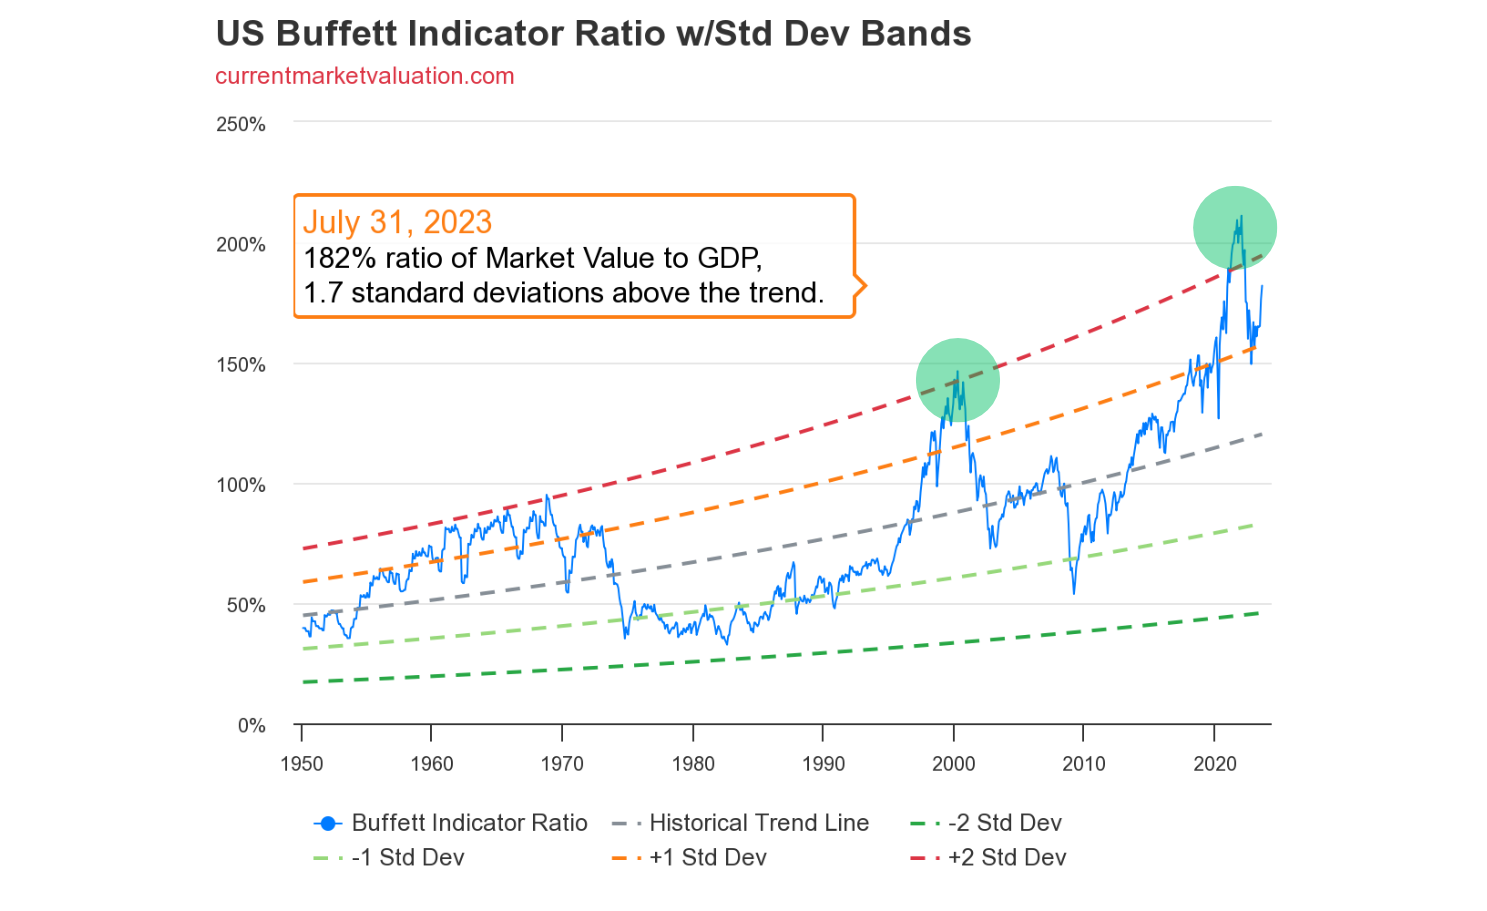
When the market has reached extremely high levels, pressing beyond +2 standard deviations, future returns are severely diminished. On the other hand, buying the market when the ratio is trading at a huge discount, near −2 standard deviations or lower, means that you’re picking up great value, with the potential for good returns into the future.
However, the market can remain overbought or oversold for long periods. Therefore, the Buffett Indicator is not designed to be a short-term market timing tool. However, it can help you identify when longer-term value is at hand for a better chance at longer-term gains.
When the indicator is greater than two standard deviations above trend, it generally suggests caution is warranted, as the potential for future gains is bleak. Here are a few actions you can take when the market sits within extreme overvaluation.
1. Get Rid of Any Excessive Risk
Within crypto, some coins and tokens are riskier and more speculative than others. Brand new cryptocurrencies that just launched which do not have a long history are a lot riskier than your large-market cap cryptos such as Bitcoin (BTC) and Ether (ETH).
Consider closing out some of these dicier cryptocurrencies — because they’ll be the ones that crash the hardest when the market ends up correcting lower.
2. Sell Some Crypto to Raise Cash
If the bull run has been especially long, it’s possible that the crypto portion of your overall portfolio is too heavy. When the Buffett Indicator is at a high level, that’s a good time to close out of some positions and reduce the exposure in order to increase your stablecoin stash. The stablecoin crypto can be used to beef up savings or transfer it to fiat cash so you can park it into other safe-haven investments.
3. Seek Out Income-Producing Opportunities
A high Buffett Indicator value suggests a downturn may be lurking. One way to extract more value in a downtrend is to invest in income-seeking opportunities. This may include loaning out your stablecoins or other cryptos to earn interest. This way, when regular income is difficult to come by, your investment can pay cash income if the economy tanks.
When the Buffett Indicator is at extremely low levels, you’ll want to reverse some of the suggestions above. For example, if a new bull run is about to kick off, then small-cap stocks tend to appreciate more than large-cap stocks do. This is because the stocks are small, and any large investment drives their values higher more quickly.
Additionally, when the Buffett Indicator is near extreme lows and a new bull run is about to kick off, look to sell out of safe-haven investments and deploy those funds into growth and emerging market opportunities.
Is the Buffett Indicator Accurate?
There is no single indicator, trader, or expert who is 100% accurate. All of the tools used to evaluate the market are simply that: tools. Understanding the backdrop for the market’s conditions can help you determine if the tool will be the best one for the job.
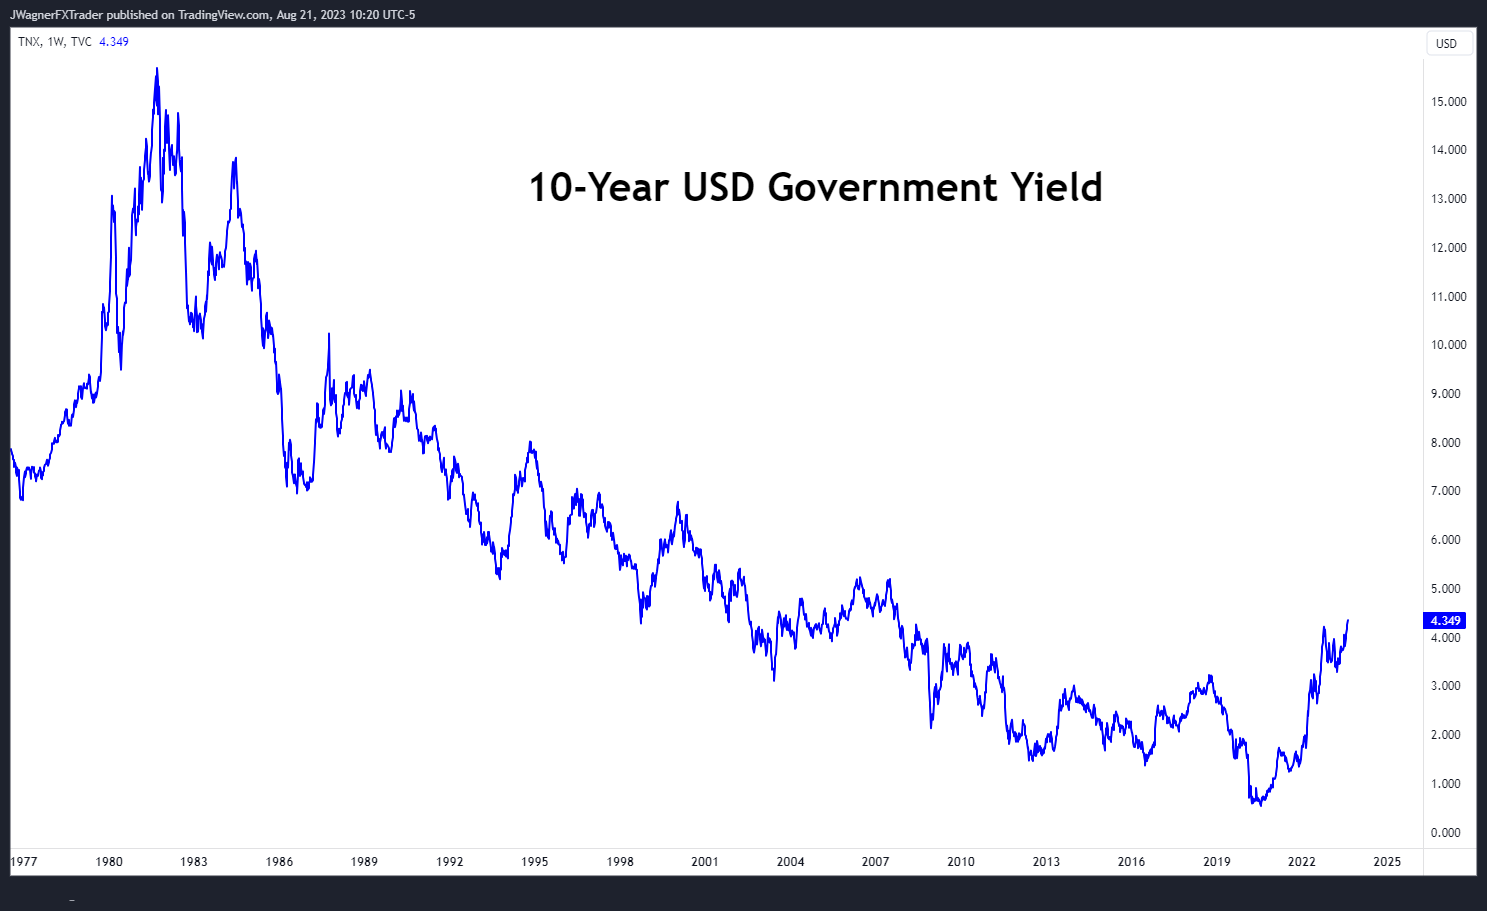
For example, take interest rates. The two most recent highs in the Buffett Indicator were in 2000 and 2021. The interest rate environment was very different during each of these periods.
In 2000, the U.S. 10-year treasury bond yield was near 6.5%. This means that investors in the stock market could park their money into a safe, durable bond to earn a 6.5% annualized return. However, the total valuation of the stock market kept on climbing as investors speculated on finding greater returns with more risk in the stock market.
On the other hand, in 2021, this same bond yields about 1.5%. Therefore, when returns are low on safe-haven investments like U.S. government bonds, investors tend to shun them, opting to invest in the stock market, where they can enjoy higher risk-adjusted returns.
Thus, the Buffett Indicator has behaved as it should during these two peaks. The indicator signaled a high in 2000, when interest rates were high, and didn’t signal the next low until 2008/2009. The stock market did find a meaningful low in 2009. On the other hand, some experts would argue that the historically low federal funds rate and additional stimulus via quantitative easing are primarily to blame for the historically high level of the Buffett Indicator in 2021.
However, in 2023, the Federal Reserve's substantial interest rate hike has led experts to anticipate a decline in stock valuations as the cost of money increases. If the stock market recedes further, the Buffett Indicator will move lower, indicating more favorable valuations.
Limitations of the Buffett Indicator
The Buffett Indicator was created as a relatively simple way to gauge overall valuations from a longer-term perspective. Owing to this simplicity, it also has some inherent limitations.
First of all, the indicator’s value won’t change much in the short term. A fluctuation in the market valuation of 10% might change the indicator by 10%, but in the end, this is not a huge difference. The indicator is not helpful in shorter-term trends, instead of working best when viewing multi-year trends.
Second, the signals from the indicator can remain at extreme overbought or oversold levels much longer than you might expect. Just because the indicator is overbought or oversold doesn’t mean the market needs to pivot in the opposite direction.
Lastly, the Buffett Indicator is applicable to crypto trading but it is still an unconventional concept in the crypto market. There is a lot of investment and factors pouring into the crypto market, driving its valuation significantly higher.
It's not uncommon for the total crypto market valuation to increase by 50–100% or decrease by 50–75% in a single year. These types of changes distort the ratios that the Buffett Indicator provides.
Additionally, we simply don’t have a lot of historical crypto data to evaluate. With the stock market, we have over 50 years of data to pull from to compare historical levels. However, Bitcoin is just in its second decade of its existence, while most other cryptocurrencies are only a couple of years old. There simply isn’t enough history in order to determine a level of overbought and oversold using the total market valuation.
Other Ways of Valuing the Crypto Market
As the crypto market is relatively new, it will likely contain new investment dollars many years into the future. Therefore, comparing the size of crypto to other large established markets is one way to value it.
For example, Bitcoin has often been labeled as a “digital gold” asset. The valuation of the physical gold market is about $10–$12 trillion. If Bitcoin is truly digital gold, then how big will it eventually become?
Will Bitcoin attain 25% of the capitalization of physical gold?
Bitcoin’s current valuation is around $500 billion and is less than 5% the value of the physical gold market. This suggests there is likely more room for Bitcoin’s value to grow.
Earlier, we mentioned that the rapidly increasing interest rates may knock down stock market values. If this truly reflects a negative growth environment for businesses, then central banks may lower interest rates to heat up inflation. If inflation rises again, cryptocurrencies like Bitcoin could benefit from such an environment.
The Bottom Line
The Buffett Indicator is a good way to understand the relative valuation of the stock market, which currently is signaling overbought. However, when applied to the crypto market, the Buffett Indicator is less useful because crypto is still within its early adoption phase.
There simply isn’t enough history behind crypto to determine if it’s overbought or oversold on a long-term basis. Weighing the market capitalization of crypto against other established markets like gold may provide a better indication of its relative value.
#Bybit #TheCryptoArk