
Inside Bar Pattern: What It Is & How to Use It for Crypto Trading

Chart reading is a vital skill for crypto traders, enabling them to make informed trading decisions. One such pattern is the inside bar, which indicates a pause in the market’s trend. Over the next few minutes, we’ll delve into the anatomy of the inside bar chart pattern, how to spot it on candlestick charts and strategies for trading this pattern in crypto markets.
Key Takeaways:
An inside bar pattern consists of two bars, with the second bar completely covered or engulfed by the first bar, indicating a pause in the market’s trend.
When trading inside bars, identify the high and low of the mother bar and enter trades in the direction of the breakout, aligning with the larger trend.
Traders should consider other technical clues, such as trend lines and the larger trend’s direction to enhance the reliability of the inside bar signals.
What Is an Inside Bar?
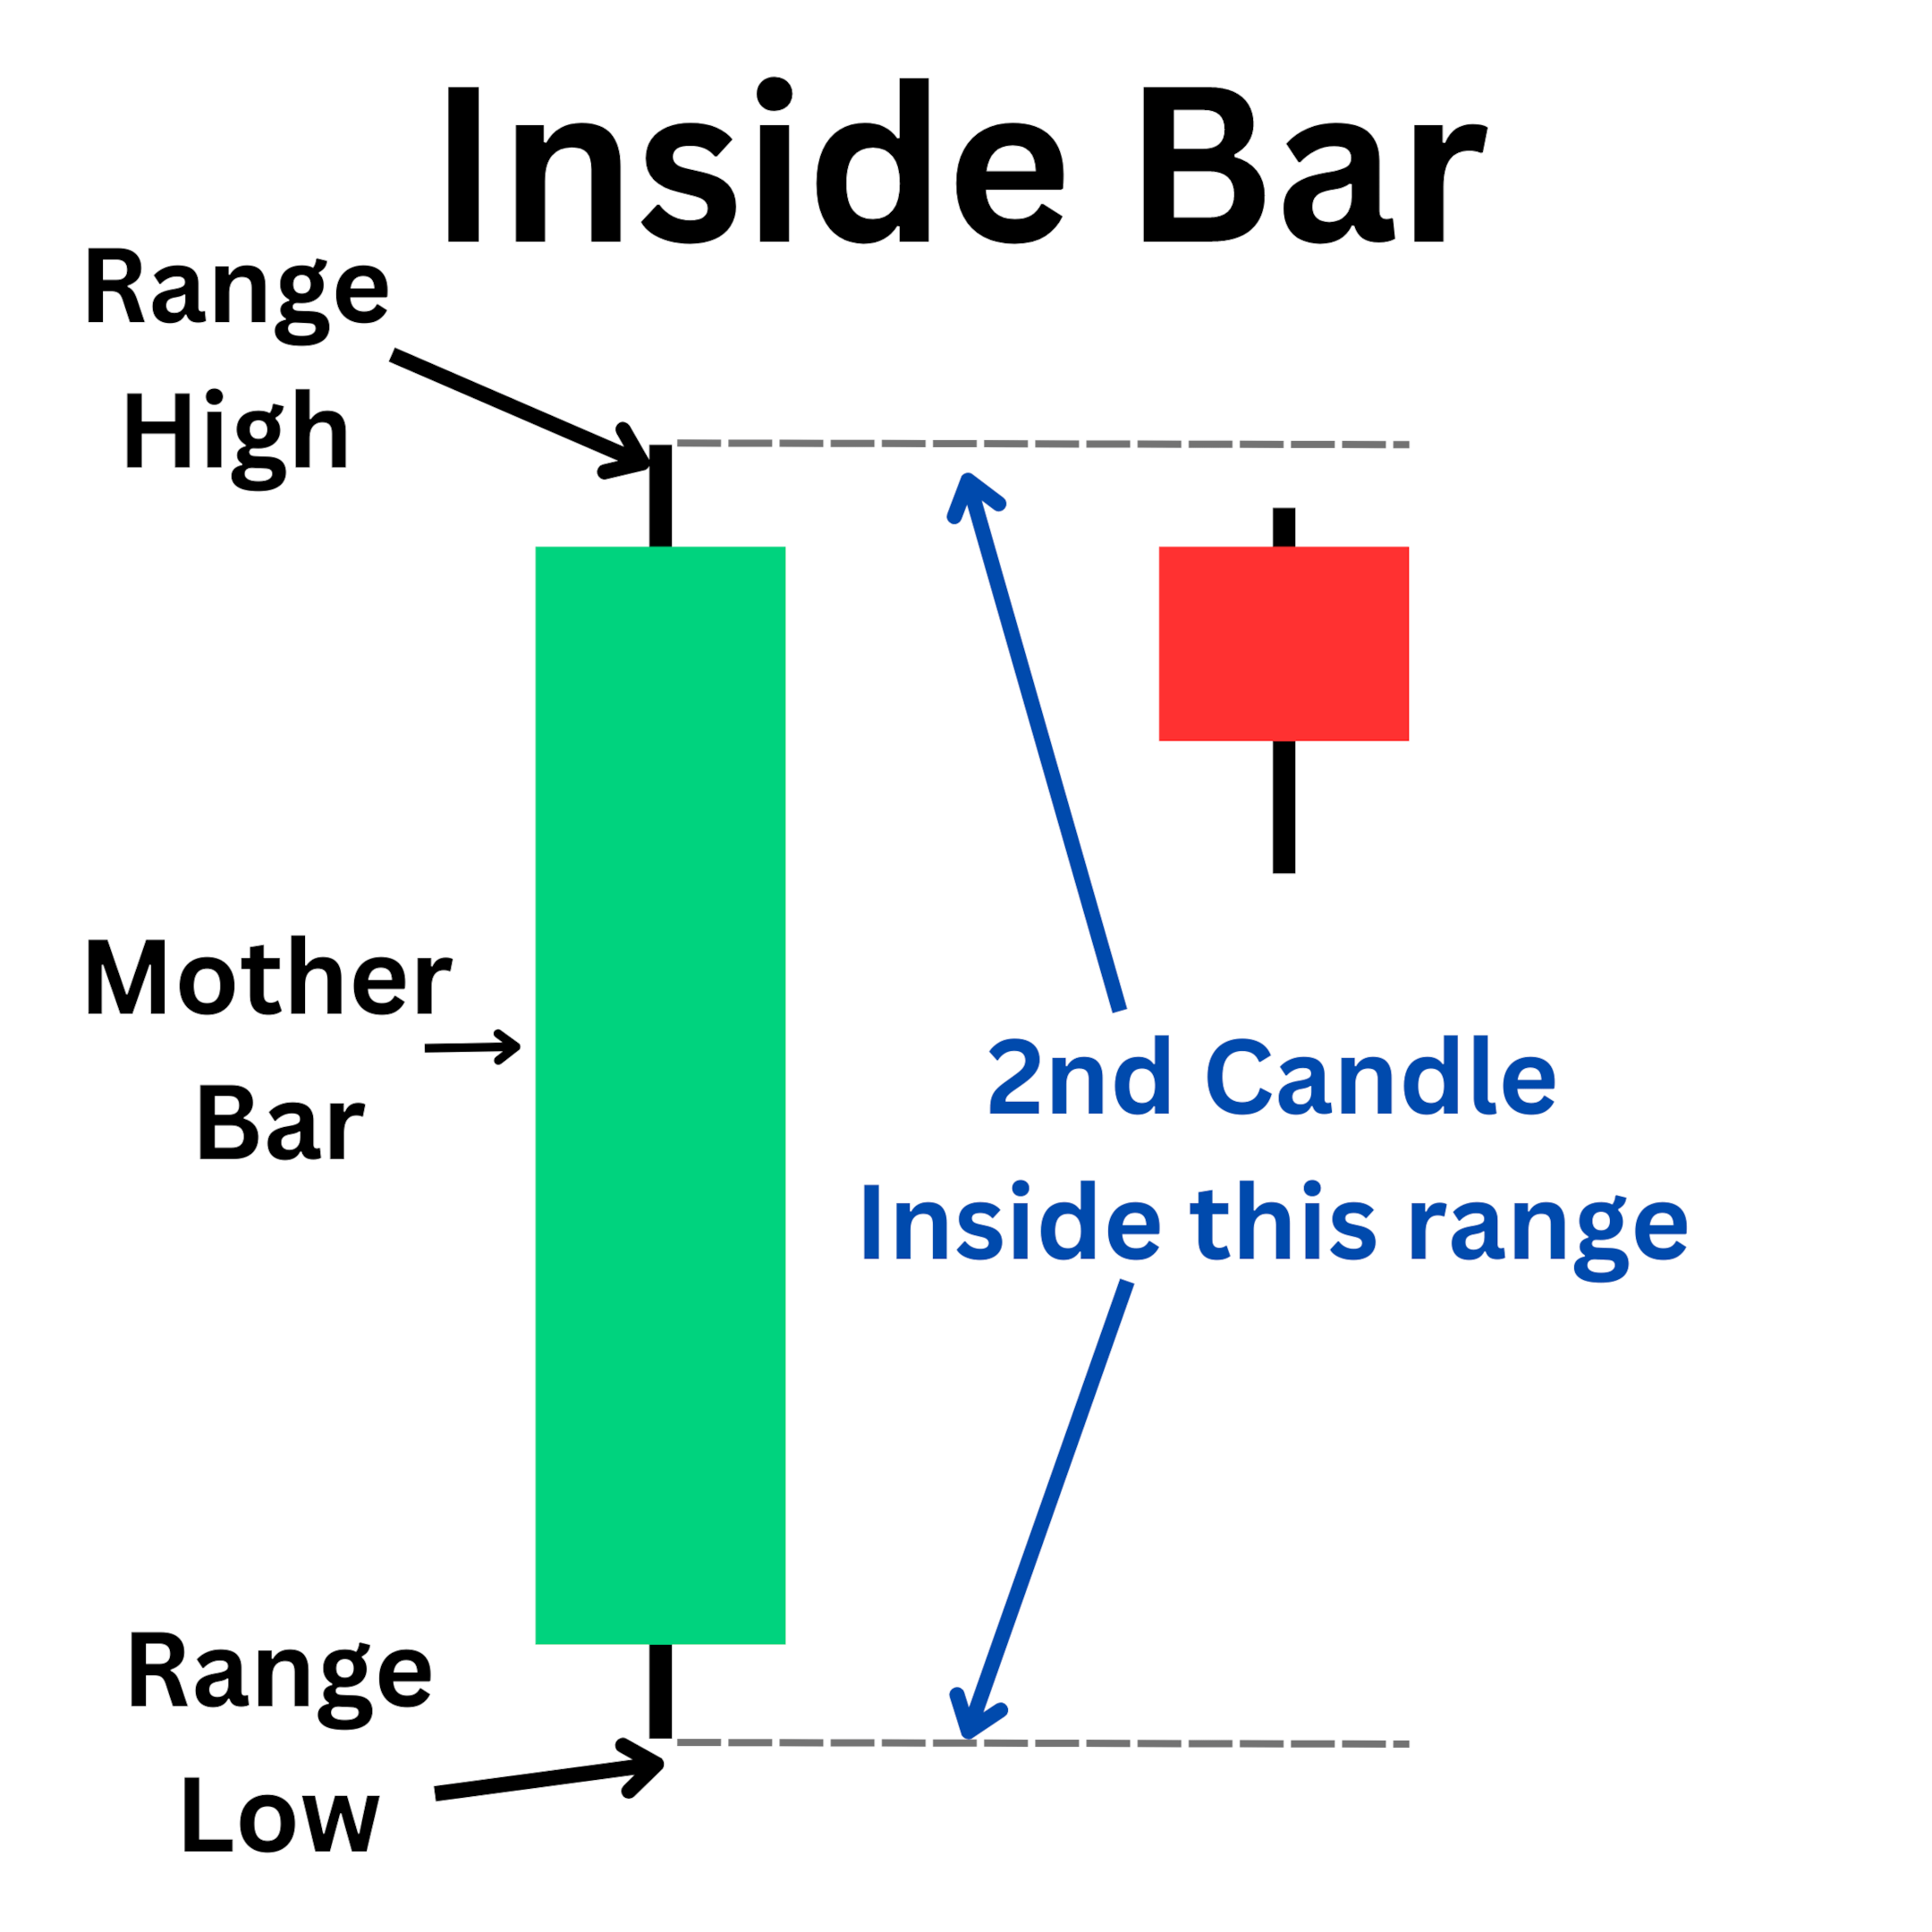
An inside bar pattern is a two-bar price action pattern in which the second bar is completely engulfed or covered by the first bar of the pattern. The formation gets its name from the second bar, consisting of a smaller range contained within the previous bar, therefore making it “inside.”
The pattern forms after a quick price movement in the market. Markets can’t trend indefinitely, and need to pause to consolidate. The inside bar consolidation range is a clue that the market is about to break, which can lead to a continuation or outright reversal.
The first bar in the pattern (the “mother bar”) sets the range high and low. The second bar is the inside bar. The high of the inside bar must be lower than the high of the mother candle. The low of the inside bar must be higher than the low of the mother candle.
How to Spot an Inside Bar Candlestick Chart Pattern
The inside bar candle pattern can form within a trending market and even during consolidation. It can easily be spotted with a bar chart or Japanese candlestick chart.
Look for a large candle followed by a smaller inside one on a daily chart time frame. The inside bar pattern can also be found on a smaller time frame, though it may produce false signals.
When you see the inside bar form, take note of the preceding trend direction. A reliable inside bar candle pattern generally breaks in the direction of the larger trend, except when it’s near support or resistance.
Also, look for the smaller inside bar to form in the upper or lower half of the first bar, as that will indicate the potential that it’s a continuation pattern.
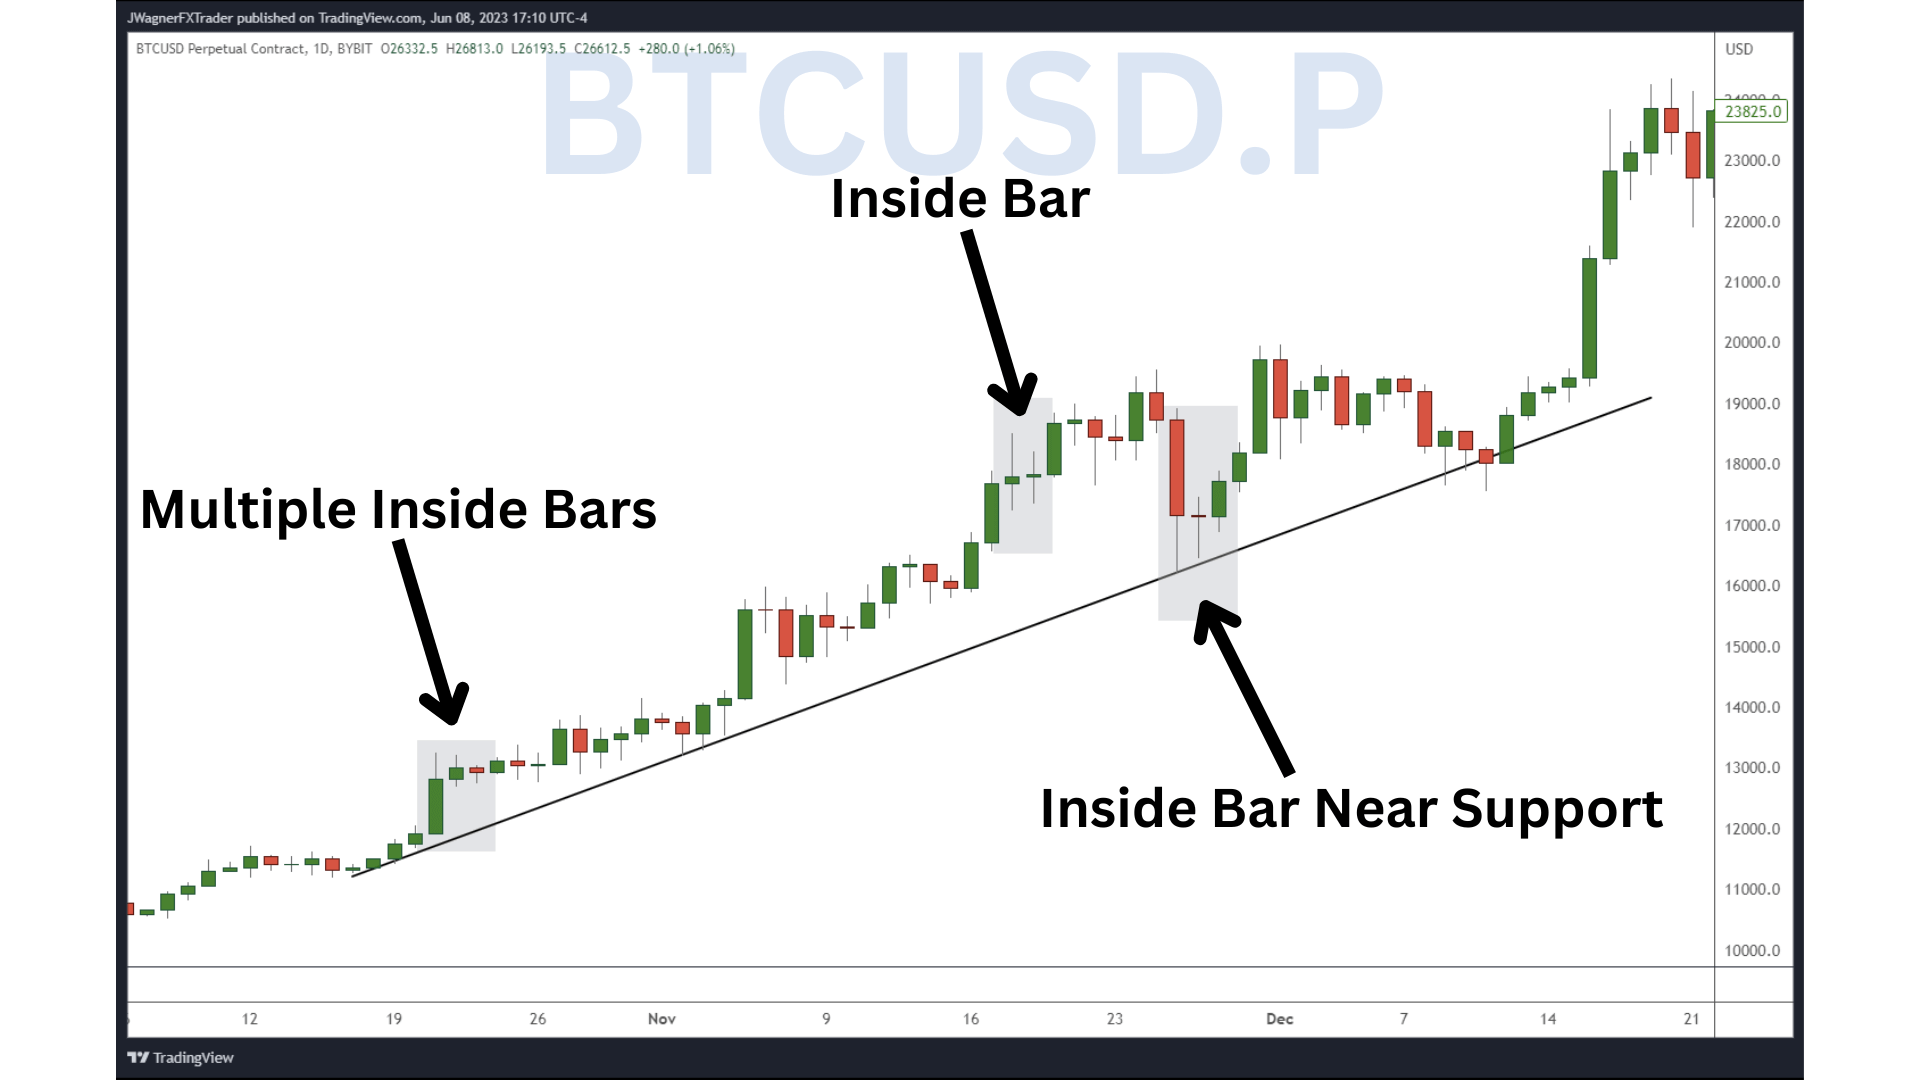
Source: TradingView
On the Bitcoin daily chart above, there are three inside bar setups within six weeks of each other. The first inside bar setup actually includes multiple inside bars, with the first inside bar a small green candle that forms in the upper half of the mother bar's range. The next candle is also an inside bar of the first setup. This profitable inside bar setup is the kickoff to a monster trend that occurred in 2020.
A few weeks later, a large ranged candle forms with a doji inside bar. This inside bar chart pattern forms at the top of an uptrend, with no resistance nearby. The price action indicates the trend is still on the move.
The third inside bar chart pattern forms as Bitcoin is correcting lower. Notice how the inside bar setups form near a support trend line. This combination hints that a bullish reversal may drive the price of Bitcoin higher.
Bullish Inside Bar Setup
By itself, the inside bar chart pattern doesn't indicate whether it’s bullish or bearish. You'll need to analyze the bar pattern using other technical tools, such as support and resistance.
Two situations generally lead up to a bullish inside bar pattern.
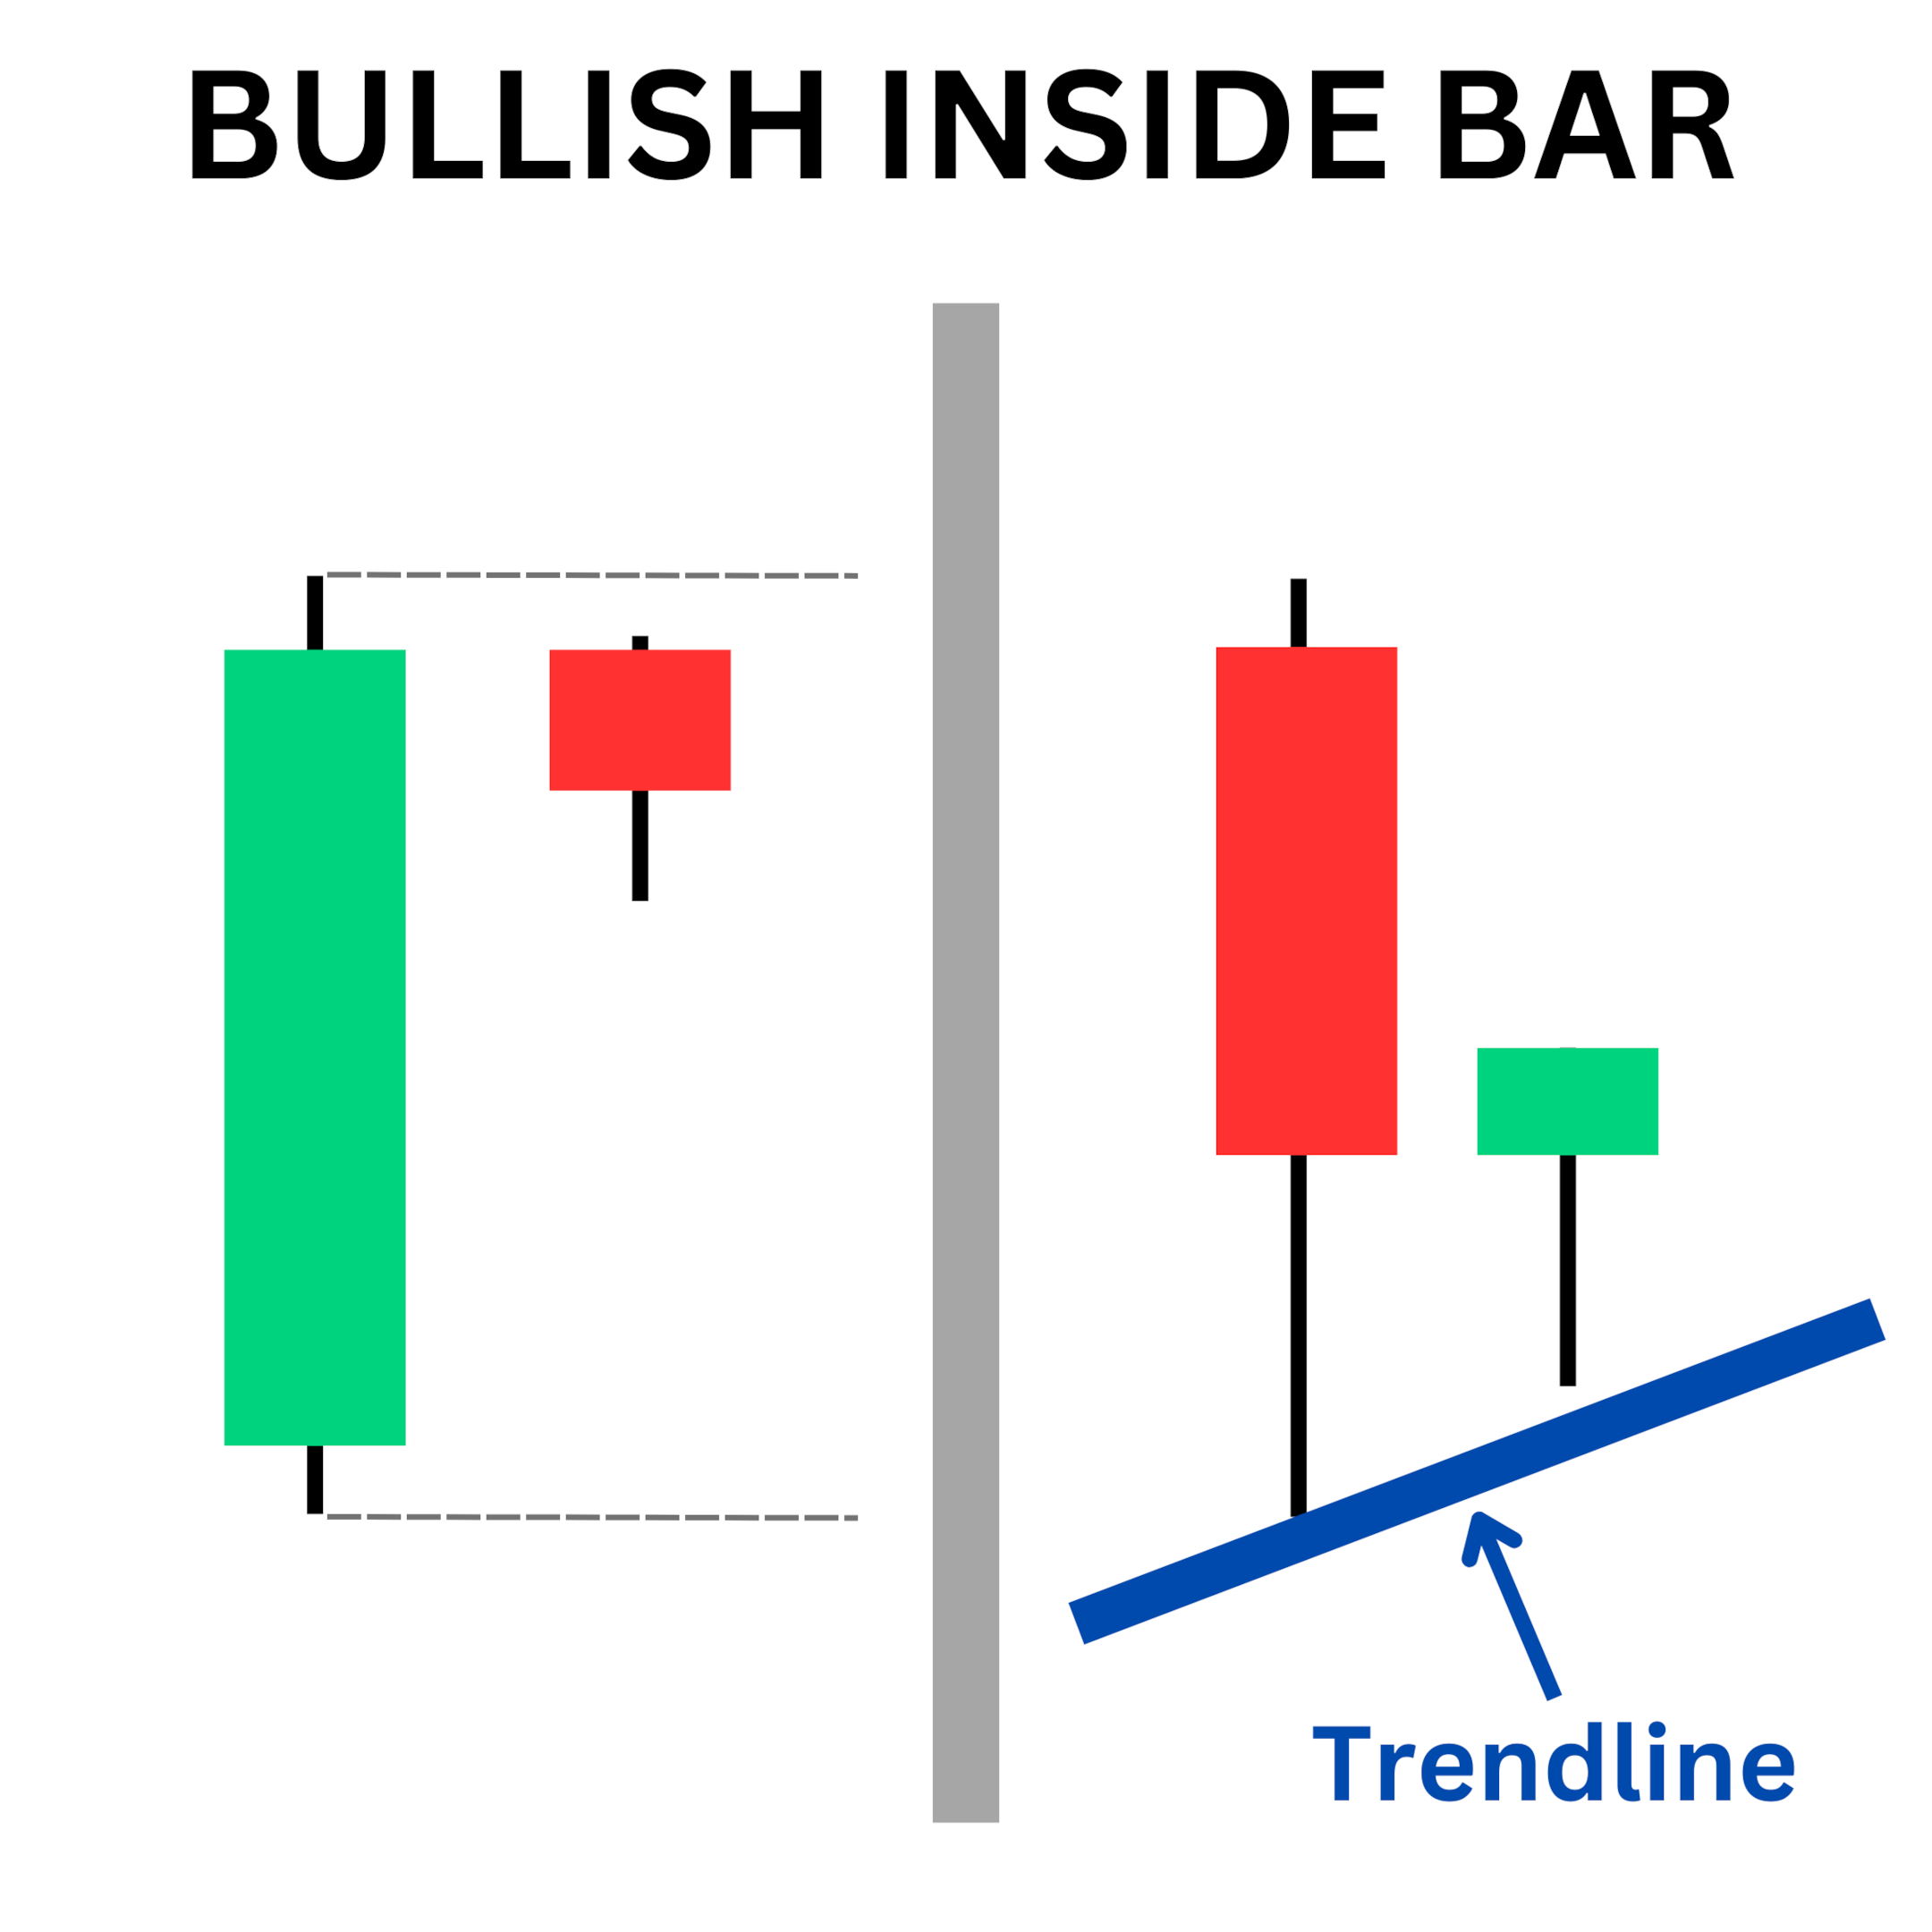
First, when the larger trend is up, look for a large bullish candle in the mother bar position. If the second candle forms within the upper half of the mother candle’s range, then we’re likely to see a bullish breakout.
The second bullish inside bar setup is when a large red mother bar forms near a horizontal or trend line support level. After the inside bar carves, anticipate a breakout above the high of the mother bar.
This second trade setup appears counterintuitive, but with technical support looming nearby, sellers will stop selling, and buyers will perceive the price as attractively low and begin to buy, leading to a potential shift in market dynamics.
Bearish Inside Bar Setup
The bearish inside bar chart pattern is similar to the bullish one, but in the opposite direction.
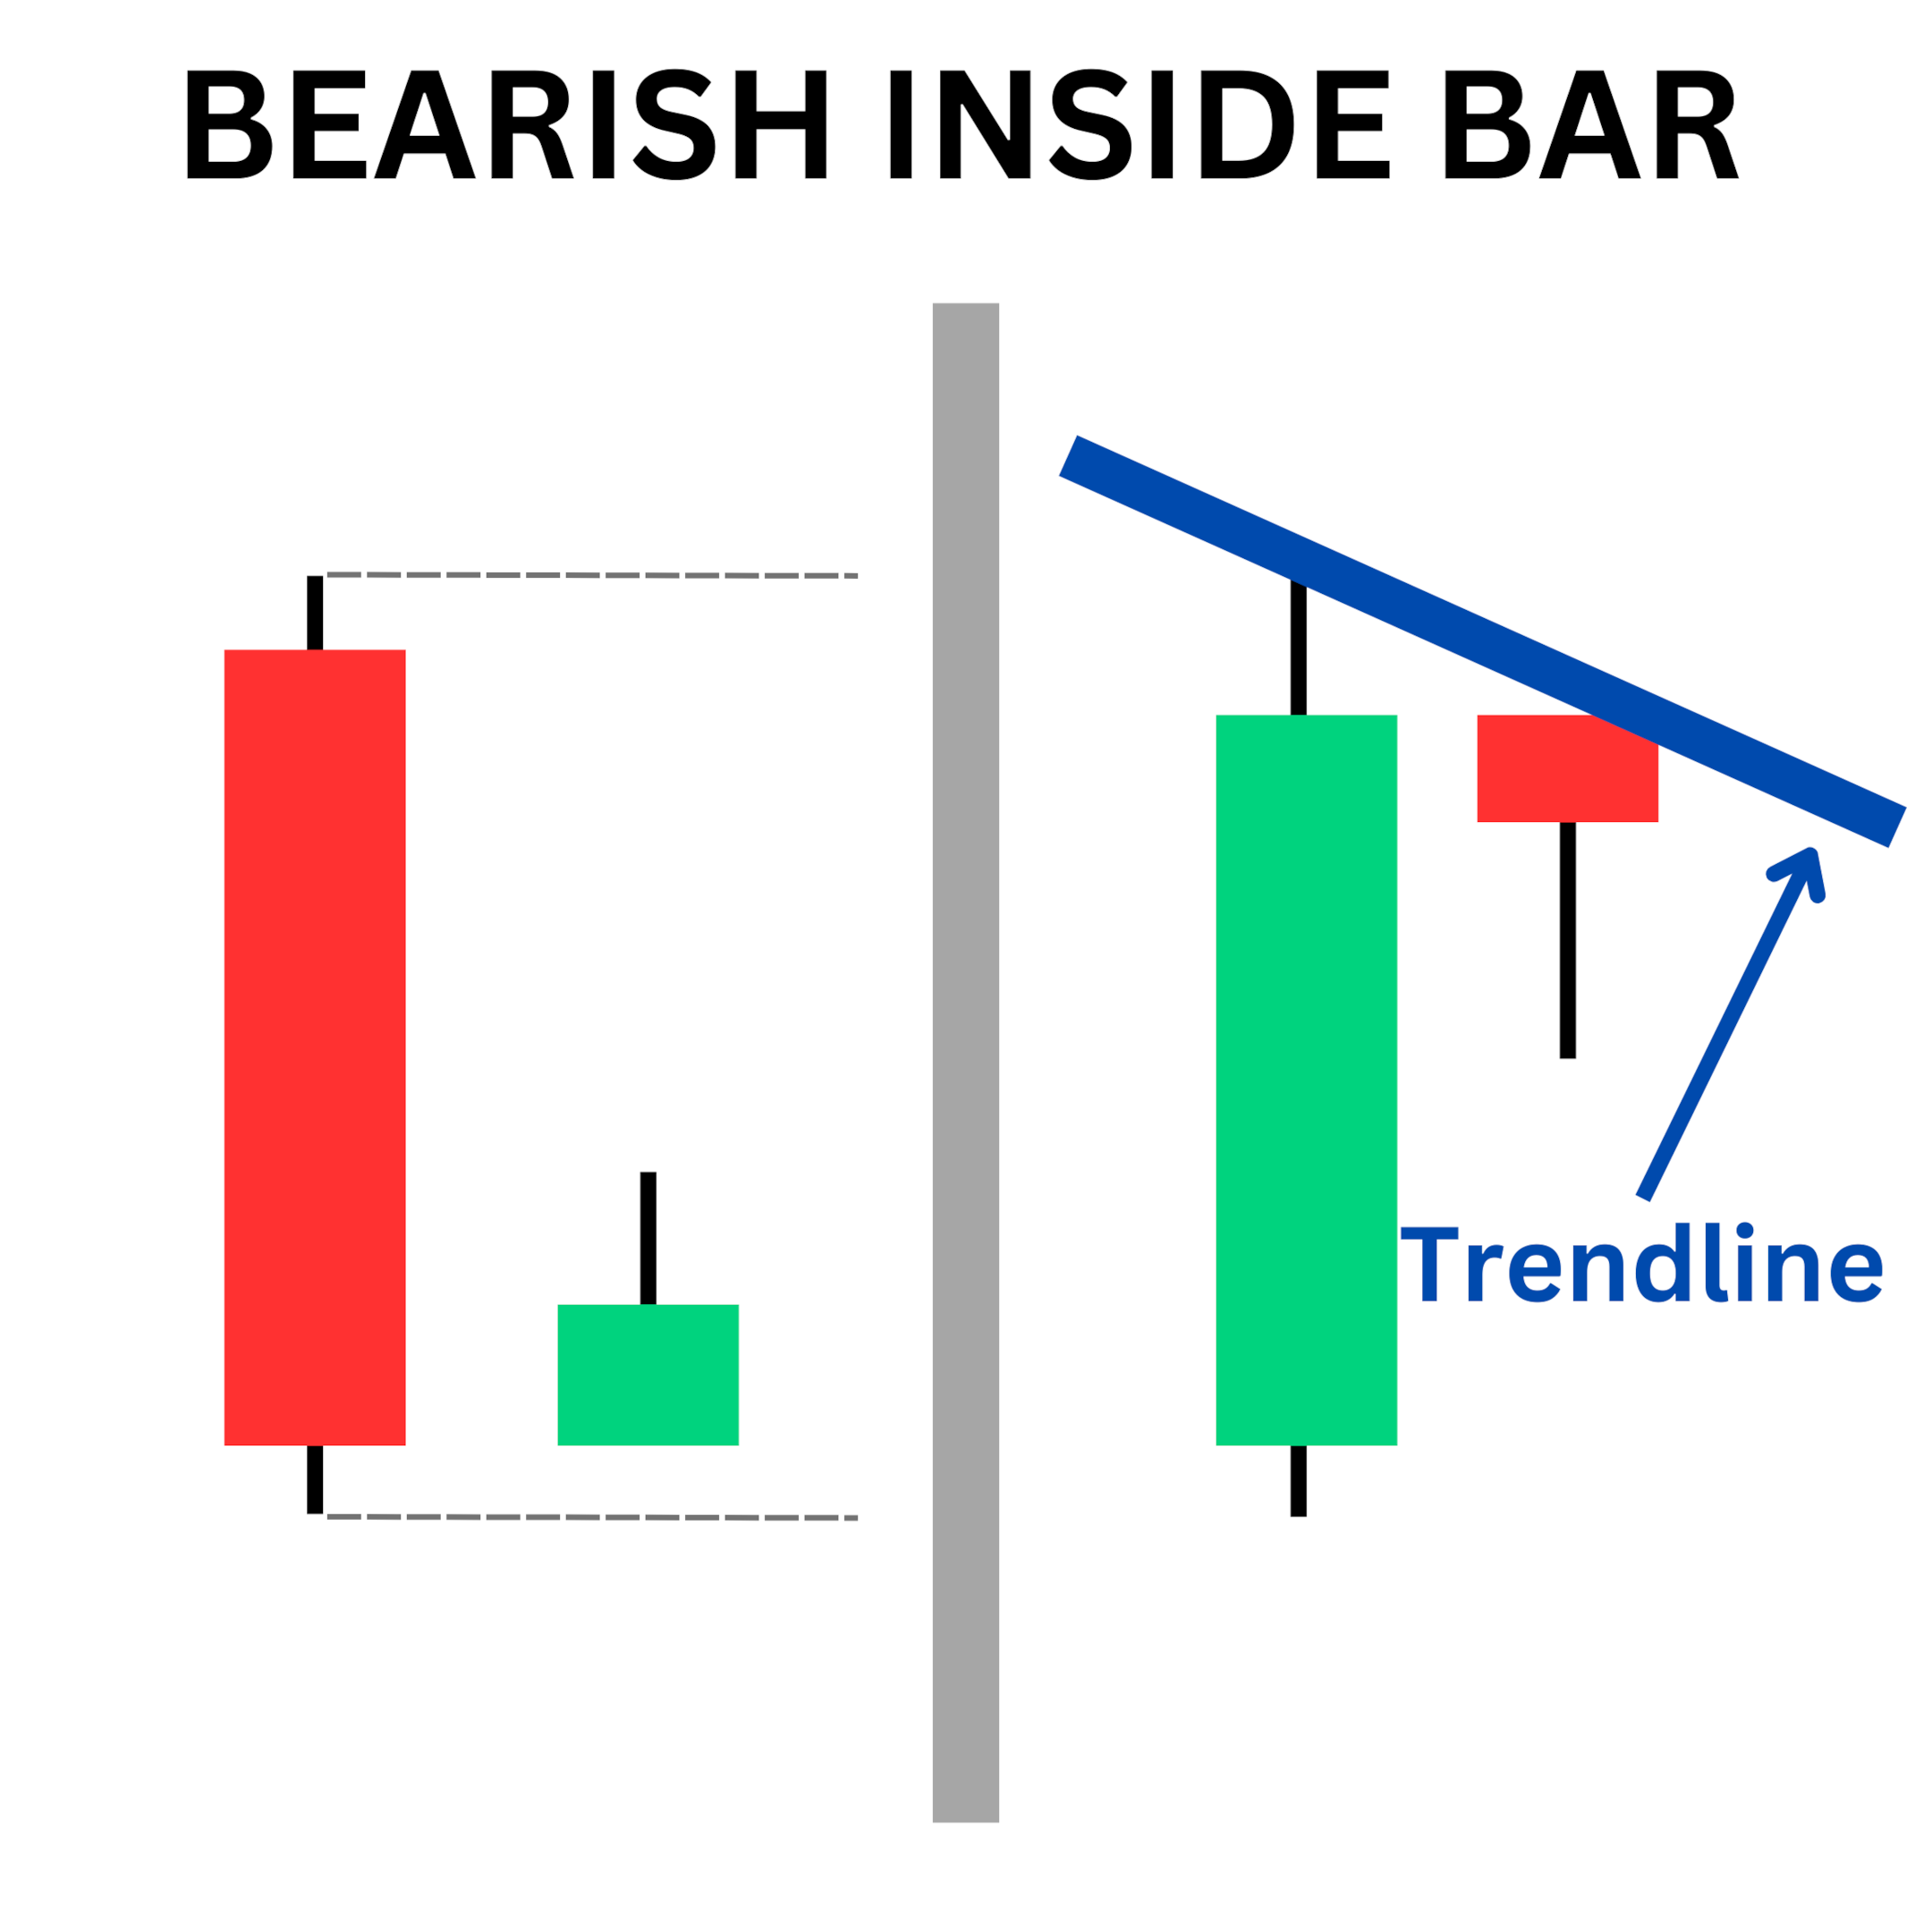
The first bearish inside bar setup appears when the larger trend is down and a large bearish candle forms. Look for an inside bar to shape within the lower half of the mother bar. The trader can anticipate a continuation of the larger trend and a bearish breakdown on price once the low of the mother bar is broken.
The second bearish inside bar setup occurs when the large green mother bar ends near resistance. Then, the inside bar appears, indicating the lack of buyer interest. There simply are not enough buyers to push the price higher, and it begins to fall. This pattern is confirmed when the crypto price breaks down below the low of the mother bar.
How to Trade the Inside Bar Candlestick Pattern
After spotting an inside bar candlestick pattern, planning the trade is fairly easy and straightforward.
Traders generally consider the inside bar candlestick to be a continuation pattern. That means traders anticipate a breakout in the direction of the larger trend. Thus, rather than buying a bullish break or selling a bearish break, traders filter their positions so that they’re trading solely in the direction of the larger trend.
Additionally, be mindful of any nearby support and resistance levels. The inside bar consolidation may be a result of support and/or resistance that may trigger a reversal.
Once you spot the inside bar chart pattern, identify the high and low prices of the mother bar. If the chart pattern is bullish, then wait for a break of the high. If the chart pattern is bearish, trade a break of the price support.
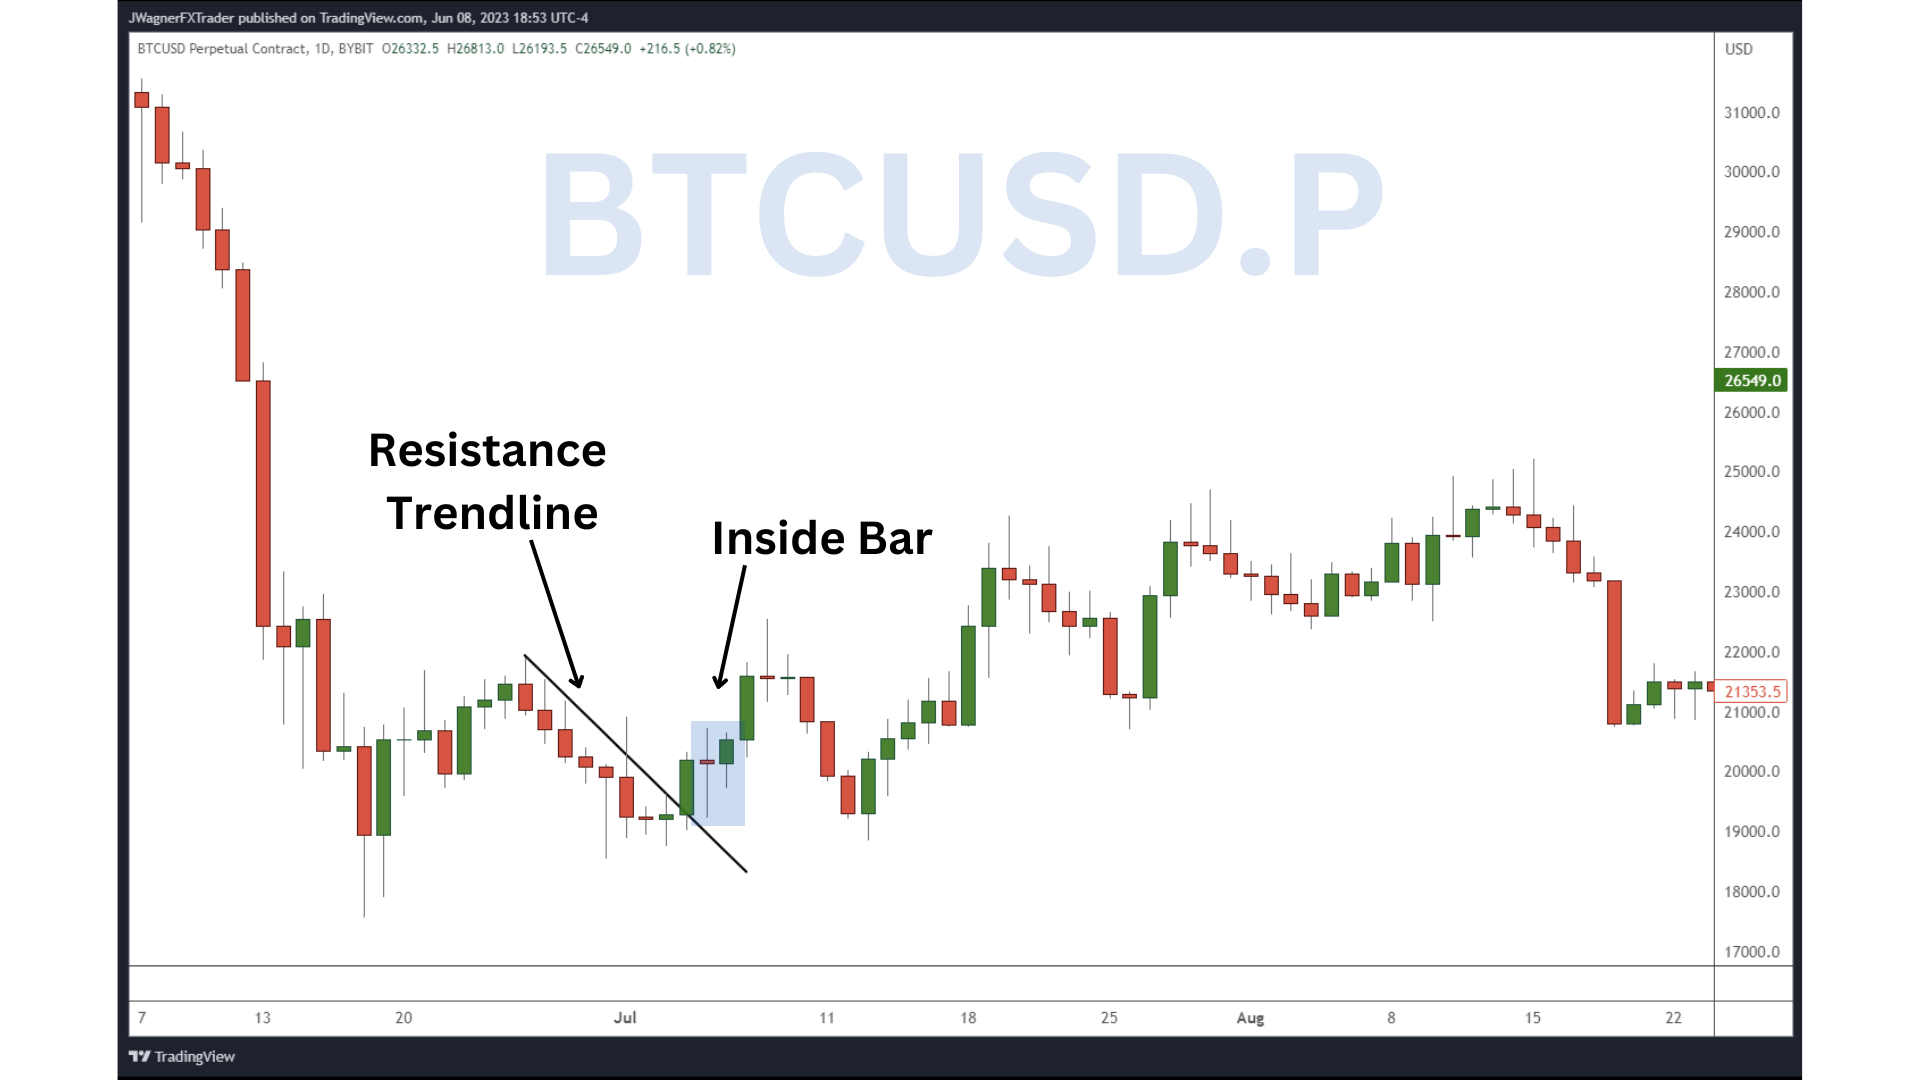
Source: TradingView
Above, we see an inside bar forming on a daily Bitcoin chart. Bitcoin is in the process of developing a base in an aggressive downtrend. Prices break above the resistance trend line, and an inside bar chart pattern appears.
This hints that Bitcoin's price is ready to move higher. Entry would be above the high of the red doji-like candle, with the stop loss below the low of the green inside bar. Take profit at twice the distance to the stop loss.
Advantages and Limitations of the Inside Bar
Inside bar patterns can form on any financial chart in any time frame. The signals generated on an hourly (or greater) chart time frame are generally stronger than the signals viewed on a minutes or seconds chart. As a result, inside bar patterns can be found frequently in markets, and it’s easy for novice traders to identify them.
The biggest limitation to the inside bar pattern is that it’s difficult to determine whether the market will continue trending in the same direction, or reverse. To overcome this obstacle, it’s important to include other technical clues. For example, if the inside bar forms near a trend line, then it will have a greater chance of reversing. On the other hand, an inside bar that forms just after a breakout has a greater chance of continuing.
Inside Bar vs. Pin Bar
The biggest difference between an inside bar and a pin bar is the number of bars, or candles, included within each pattern. The inside bar is a two-candle pattern, while the pin bar is a single-candle pattern.
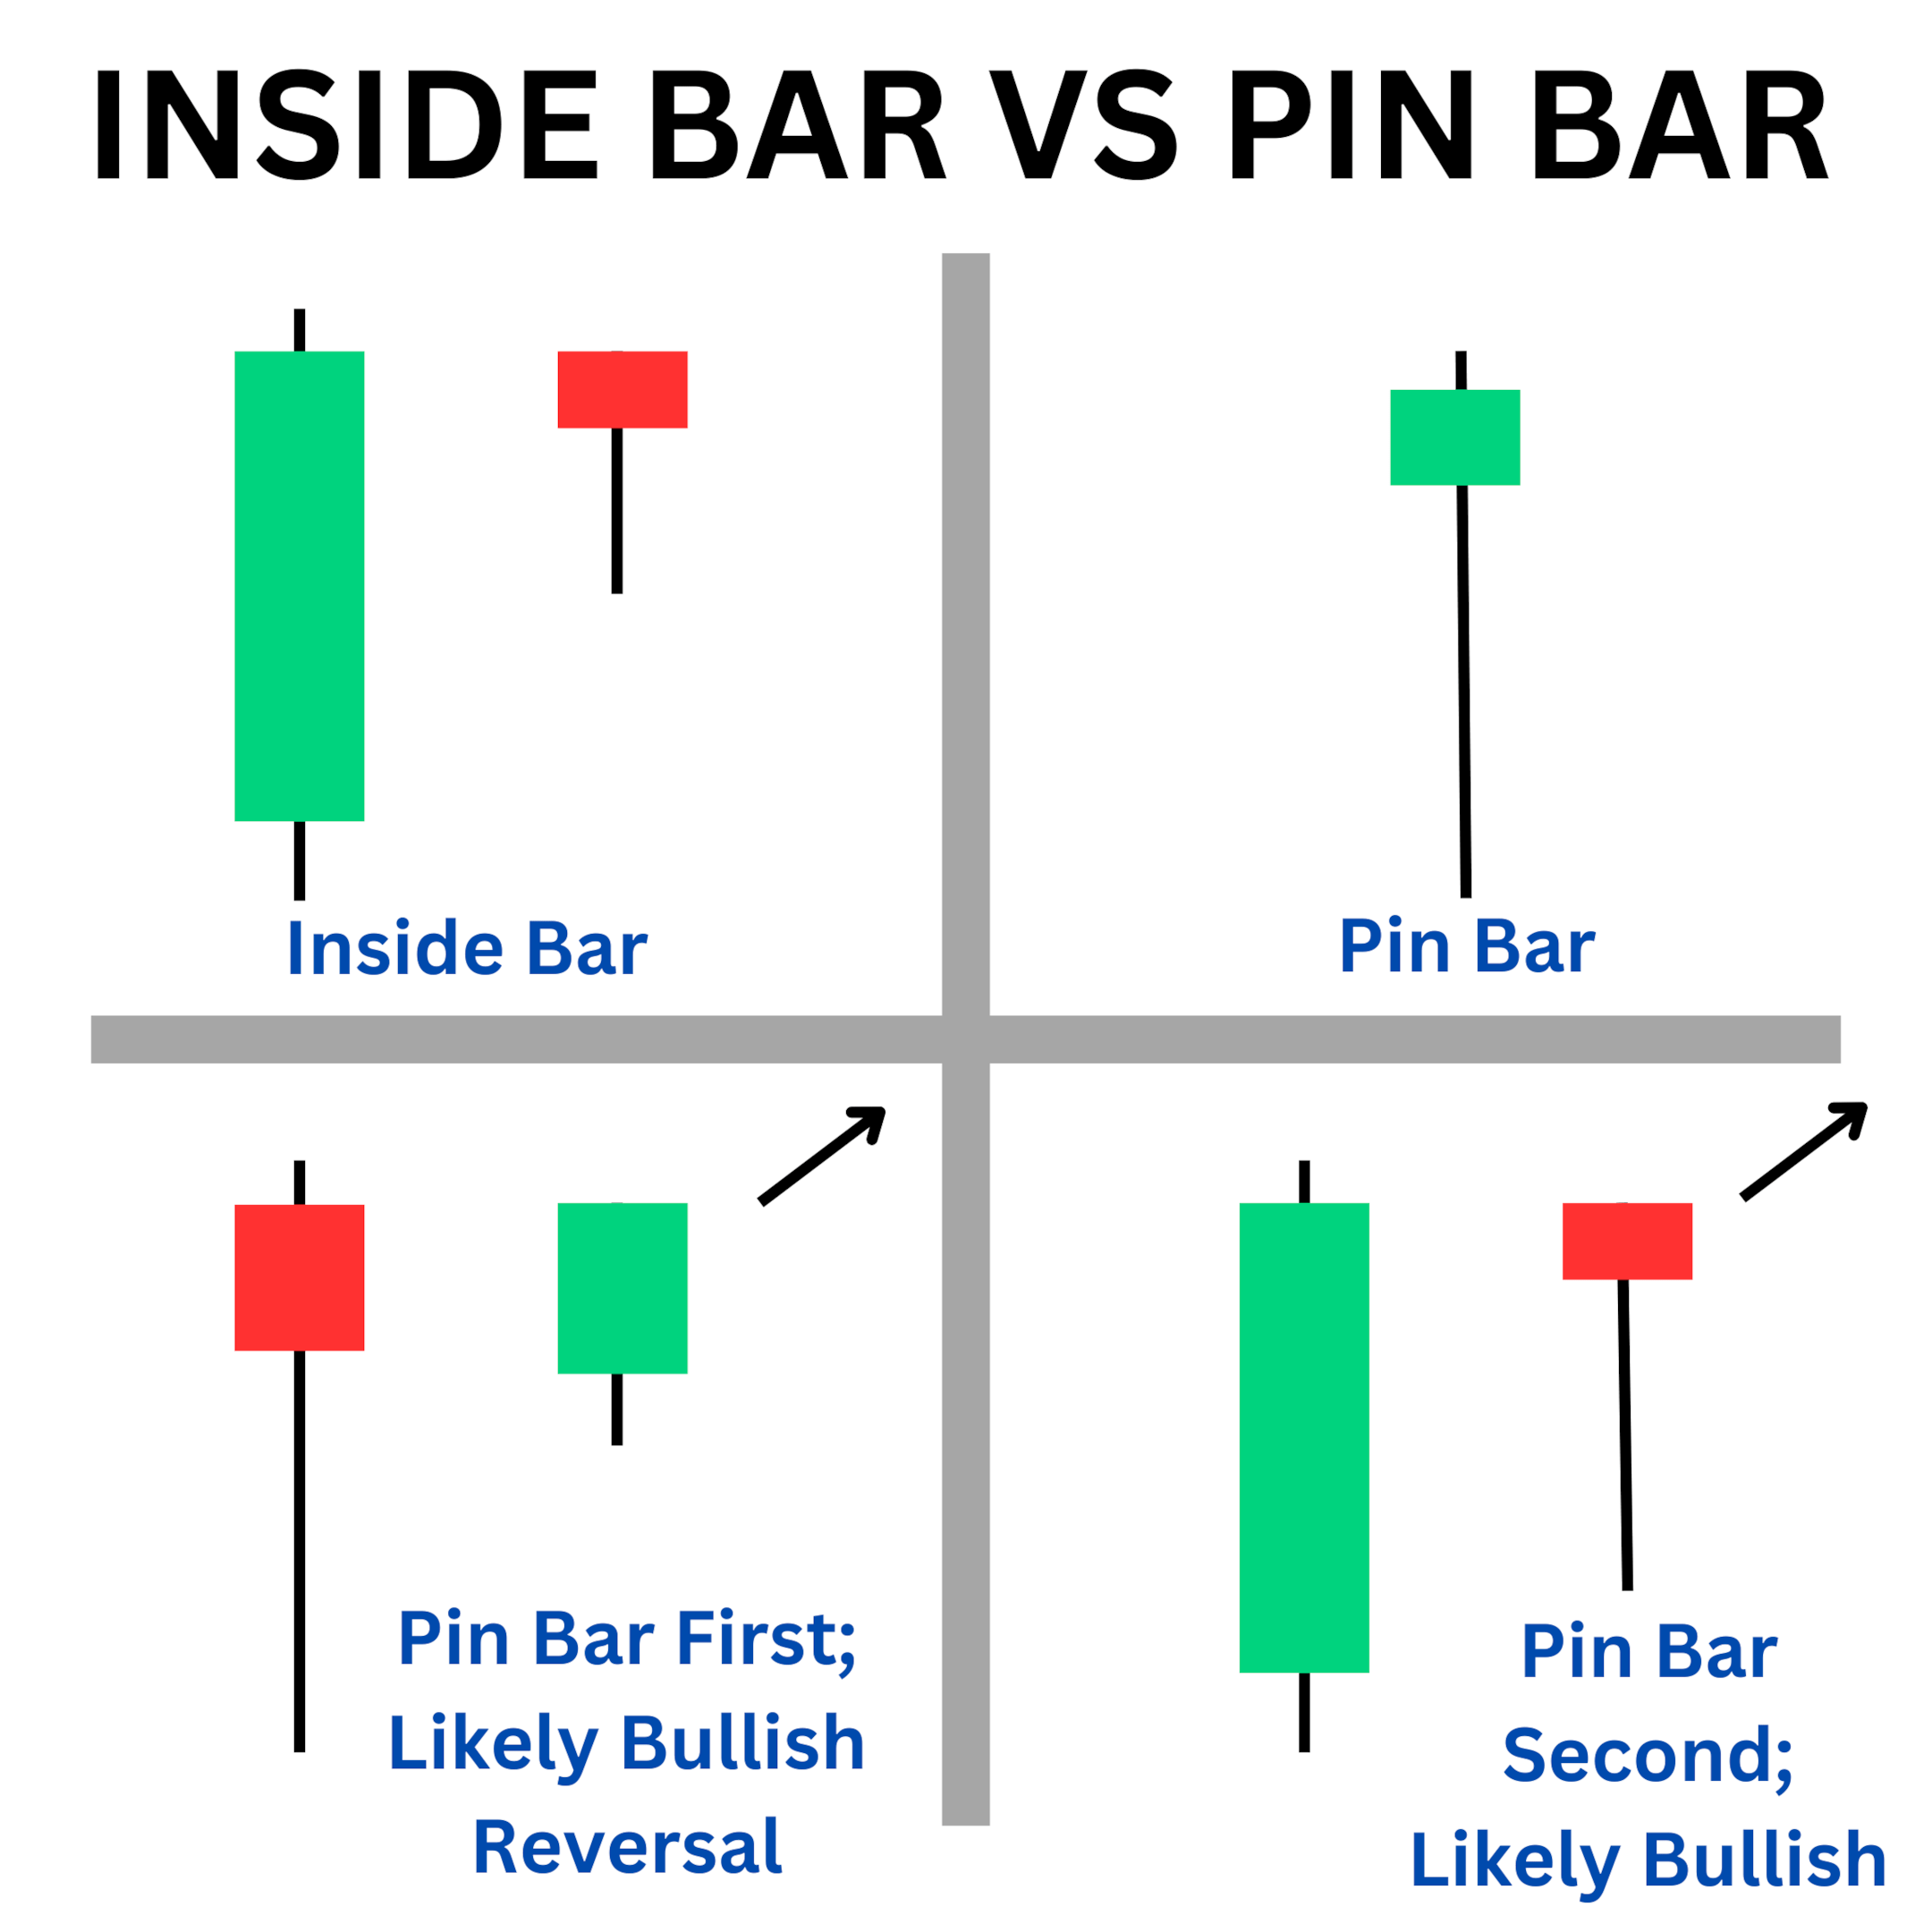
Additionally, the pin bar represents rejection and reversal. If the first candle of an inside bar is a pin bar, then it may signal the inside bar pattern is a reversal pattern. The opposite holds true if the second bar of the inside bar is a pin bar pattern. This combination suggests the inside bar will be a continuation.
The Bottom Line
Mastering chart reading and recognizing price patterns like the inside bar can significantly enhance a trader’s decision-making process. While inside bars offer valuable insights into potential continuations and reversals, it’s essential to also consider other technical factors.
By combining inside bars with additional indicators, such as trend lines, traders can increase the probability of successful trades.
Candlestick Patterns Professional Traders Use
Best candlestick patterns — A curated list of candlestick patterns frequently used by traders
How to Read Candlestick Charts in Crypto — Learn the basics of candlestick patterns
Crypto Chart Patterns — (Chart basics: Trend, neckline, wedges)
Doji Candlestick — Basic candlestick unit
Bullish candlestick patterns
Bearish candlestick patterns
Other candlestick patterns
Harami — Both bullish and bearish
Hammer — Both bullish and bearish
Double Top and Bottom — Both bullish and bearish
Spinning Top — Both bullish and bearish
Marubozu Candlestick — Both bullish and bearish
Tweezer Top and Bottom — Both bullish and bearish
Continuation Patterns — Determining a continuing trend
Symmetrical Triangle — Both bullish and bearish
#Bybit #TheCryptoArk
